
Stopping a Pandemic in Mid-Flight: How Small Changes in Virus Transmission Parameters Can Avert Mass Casualties#
Note
Supplementary (brief).
wwv-sgir-dv_ClaOp47Max_OOv2r0p0_2026m04d27_16h32Abstract
The COVID-19 pandemic demonstrated that humanity’s ability to respond to novel respiratory viruses remains dangerously inadequate. Here we present the SGIR model, an extension of the classical Susceptible-Infected-Removed (SIR) framework that explicitly tracks the Gap of Germs — the spatial and temporal separation between infectious agents and susceptible hosts. We implement this concept in PandemicSociety101, a stochastic mass-action model with seven infection stages, a simplified testing laboratory, hospital capacity, and multiple death pathways, simulated using both ordinary differential equations (ODE) and the Stochastic Simulation Algorithm (SSA).
Using parameters calibrated to the US COVID-19 pandemic (330 million population, starting from 16 infections on 2020m02d14), we show that an uncontrolled pandemic infects approximately 289 million people and kills approximately 13 million in Scenario 1 (no behavioral change). In Scenario 2 (starting from 1.5 million infections on 2020m05d17), we demonstrate that a 50% reduction in both virus Decay time and Catch probability — achievable through coordinated use of facemasks, hygiene, and social distancing — can stop the pandemic at approximately 4.8 million total infections and 310,000 deaths, representing a 60-fold reduction in infections and a 42-fold reduction in deaths compared to uncontrolled spread.
We also identify linear fooling, a dangerous cognitive trap in which limited testing capacity creates an illusion of pandemic control precisely when infections are growing fastest. These results suggest that non-pharmaceutical interventions targeting the Gap of Germs can be remarkably effective, even without vaccines or herd immunity, provided they are deployed with sufficient coordination across the population.
Broader Significance
Pandemics are the most tractable of the civilizational-scale threats humanity faces today. Unlike nuclear risk or climate change, a respiratory pandemic plays out on a timescale where coordinated behavior change — masks, ventilation, distancing — can measurably alter outcomes within weeks. The scientific result of this paper is a 60-fold reduction in deaths from modest coordinated action; the deeper message is that the infrastructure to deploy such coordination does not currently exist at global scale, and that the cognitive traps (such as linear fooling) which obscured the pandemic’s trajectory are the same traps that obscure other existential threats. Readers concerned with pandemic preparedness, global health infrastructure, cross-disciplinary modeling, or the governance foundations needed for coordinated species-scale responses will find this paper’s methods and findings directly relevant.
1. Introduction#
The COVID-19 pandemic killed millions of people worldwide and exposed fundamental weaknesses in how societies understand, monitor, and respond to infectious disease outbreaks. While vaccines eventually became available, the period before their deployment saw enormous variation in outcomes across countries and regions, with non-pharmaceutical interventions (NPIs) such as facemasks, social distancing, and hygiene practices playing a critical but contested role [Talic et al., 2021]. Major modeling efforts during the pandemic — including the Imperial College projections that drove UK lockdown policy [Ferguson et al., 2020], the SIDARTHE model for Italy [Giordano et al., 2020], and projections of post-pandemic transmission dynamics [Kissler et al., 2020] — demonstrated both the power and the limitations of mathematical modeling for guiding pandemic response.
The classical Susceptible-Infected-Removed (SIR) model ([Kermack and McKendrick, 1927]) and its many extensions have been the workhorses of mathematical epidemiology for nearly a century. These models typically represent transmission as a direct interaction between Susceptible and Infected individuals, parameterized by a transmission rate that implicitly bundles together all the physical, biological, and behavioral factors that determine whether infection occurs.
This implicit bundling, while mathematically convenient, obscures the mechanistic chain through which respiratory viruses actually spread: an infected person sheds virus particles into the environment, those particles persist for some time before a susceptible person may catch them — if they don’t decay before. Each of these three steps — Shed, Decay, and Catch — can be independently influenced by human behavior and technology. Facemasks reduce both Shed and Catch rates. Ventilation and UV sterilization increase Decay rates. Social distancing reduces the probability that shed virus reaches a susceptible person before decaying.
We propose the SGIR model (Susceptible-Gap-Infected-Removed) as a conceptual extension that makes this mechanistic chain explicit by tracking the Gap of Germs — the effective separation between infectious agents and susceptible hosts. The Gap is not merely a spatial distance; it is a composite measure that incorporates the physical, temporal, and behavioral barriers that virus particles must traverse to cause new infections. Increasing the Gap is the fundamental goal of all non-pharmaceutical pandemic defense.
This reframing has a practical consequence: it connects social justice concerns directly to epidemiological outcomes. Crowding, poverty, and inadequate housing all shrink the Gap of Germs, mechanistically explaining why disadvantaged populations bear disproportionate pandemic burdens ([Caplan et al., 2020], [Mosley et al., 2025]). Conversely, investments in living space, ventilation, and workplace safety increase the Gap, providing disease protection as a side effect of equitable development.
To test whether realistic changes in Shed, Decay, and Catch rates could stop a pandemic the size of COVID-19, we implemented the SGIR concept in PandemicSociety101 — a detailed stochastic simulation model built in the prototype Evolvix modeling language. The model tracks individuals through seven stages of infection, includes a simplified testing laboratory and hospital system, and supports both deterministic (ODE) and stochastic (SSA) simulation modes.
2. Model Description#
2.1 The SGIR Concept#
The classical SIR model tracks three compartments: Susceptible (S), Infected (I), and Removed (R). Transmission occurs when S and I individuals interact, at a rate proportional to the product S * I.
The SGIR model introduces a fourth conceptual compartment: the Gap (G), representing the environment through which virus particles must travel between an infected source and a susceptible target. The transmission chain becomes:
Infected — (Shed) —> Gap — (survive Decay) —> Catch —> Susceptible becomes Infected
Each step has its own rate:
Shed rate: How many virus particles an infected person releases per unit time. This depends on infection stage (asymptomatic individuals may shed less or more than symptomatic ones), respiratory activity (singing sheds more than breathing), and protective measures (masks reduce shedding).
Decay rate: How quickly virus particles become non-infectious in the environment. This depends on environmental conditions (temperature, humidity, UV exposure), surface properties, and active decontamination measures.
Catch rate: The probability that a susceptible person encounters and is infected by surviving virus particles. This depends on proximity, ventilation, protective equipment (masks), and individual immune factors.
The Gap of Germs is effectively the inverse of the product of these three rates: when any rate decreases, the Gap increases and transmission slows. The key insight is that small reductions in each of the three rates compound multiplicatively, potentially achieving large overall reductions in transmission without requiring any single intervention to be perfectly effective.
2.2 PandemicSociety101: Implementation#
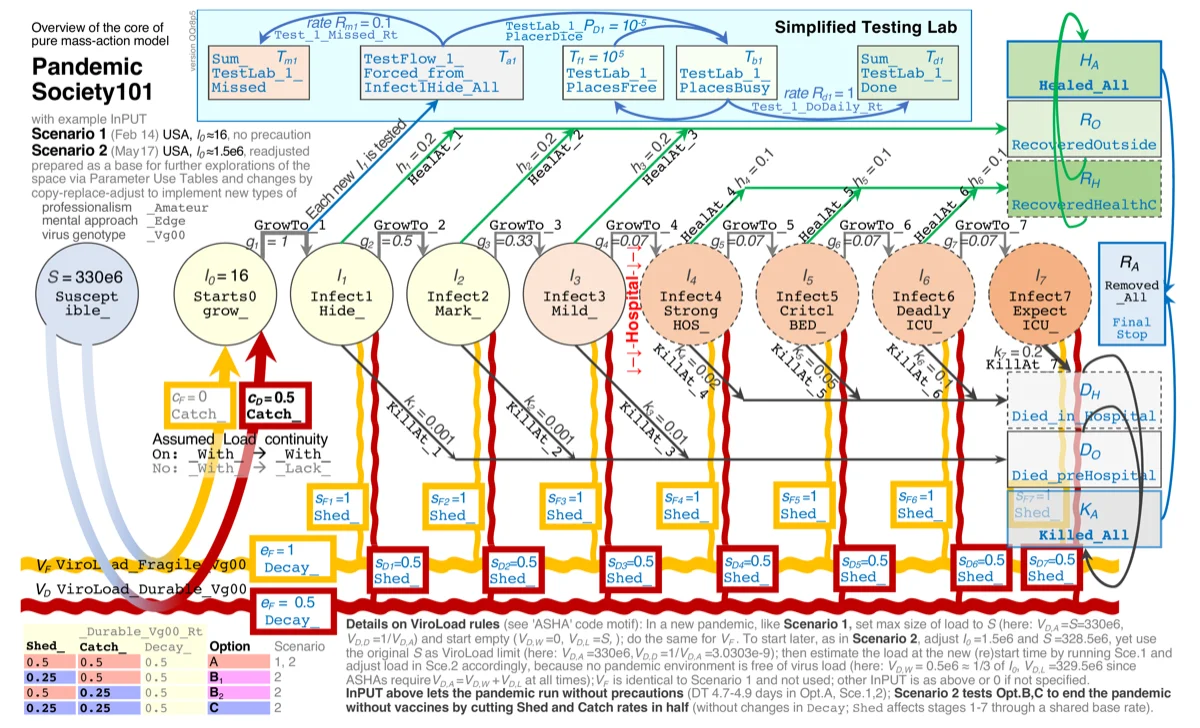
Figure 1 provides an overview of the complete PandemicSociety101 model architecture, showing all compartments, transitions, rate parameters, and the connections between infection stages, the testing laboratory, hospital system, and recovery/death pathways. The model’s input scenarios (Scenario 1: Feb 2020, Scenario 2: May 2020) and their parameter configurations are also indicated.
PandemicSociety101 implements the SGIR concept as a pure mass-action stochastic model using the prototype Evolvix modeling language (Variant MMs0r3p1). The model uses the Sorting Direct Method for stochastic simulation (Ehlert and Loewe, 2014) and the Sundials IDAS solver for deterministic ODE integration. All rates are specified in units of 1/day.
Infection stages. The model tracks individuals through seven infection stages following initial virus contact:
Stage |
Duration |
Description |
|---|---|---|
Starts0grow |
1 day |
Virus growth initiated; not yet infectious |
Infect1Hide |
2 days |
Infectious, high shed, no symptoms, hidden status |
Infect2Anti |
3 days |
Infectious, high shed, hidden, antibody-positive |
Infect3Mild |
2 weeks |
Infectious, symptomatic; most individuals recover here |
Infect4StrongHOS |
2 weeks |
Strong symptoms, requires hospital bed |
Infect5CritclBED |
2 weeks |
Critical symptoms, needs hospital bed or dies |
Infect6DeadlyICU |
2 weeks |
Needs ICU or dies |
Infect7ExpectICU |
2 weeks |
Expected death; beyond ICU capacity to save |
Individuals progress through these stages and exit the pandemic as either Recovered (outside or from hospital) or Dead (pre-hospital or in hospital). Recovered individuals are assumed immune and cannot be reinfected within the simulation timeframe.
Virus tracking via ASHA. The environmental virus load (the “Gap”) is tracked using the ASHA (Aggregated State Homogeneity Approximator) framework, which maintains density-dependent dynamics by tracking the number of environmental “places” that are either contaminated (With) or clean (Lack) out of a fixed total (Aces). This provides proper density-dependent saturation — the environment has a finite capacity for virus, preventing unrealistic exponential accumulation. The idea for ASHA grew from the need to be able to tune more parameters of population models than usually exposed in (over-)simplified models. Mallet (2012) [Mallet, 2012] describes examples for the profound loss of understanding that can result from oversimplified models that pack too much biology into a composite parameter.
The ASHA framework is built on two concepts illustrated in Figure 2 and 3.
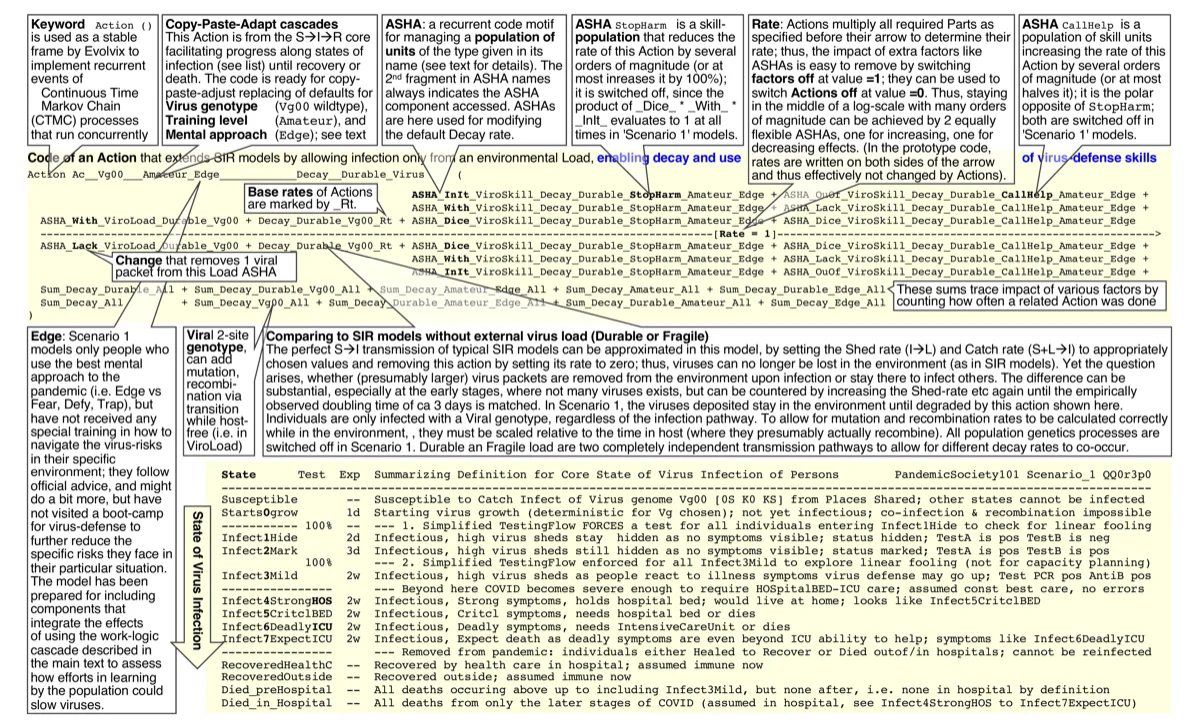
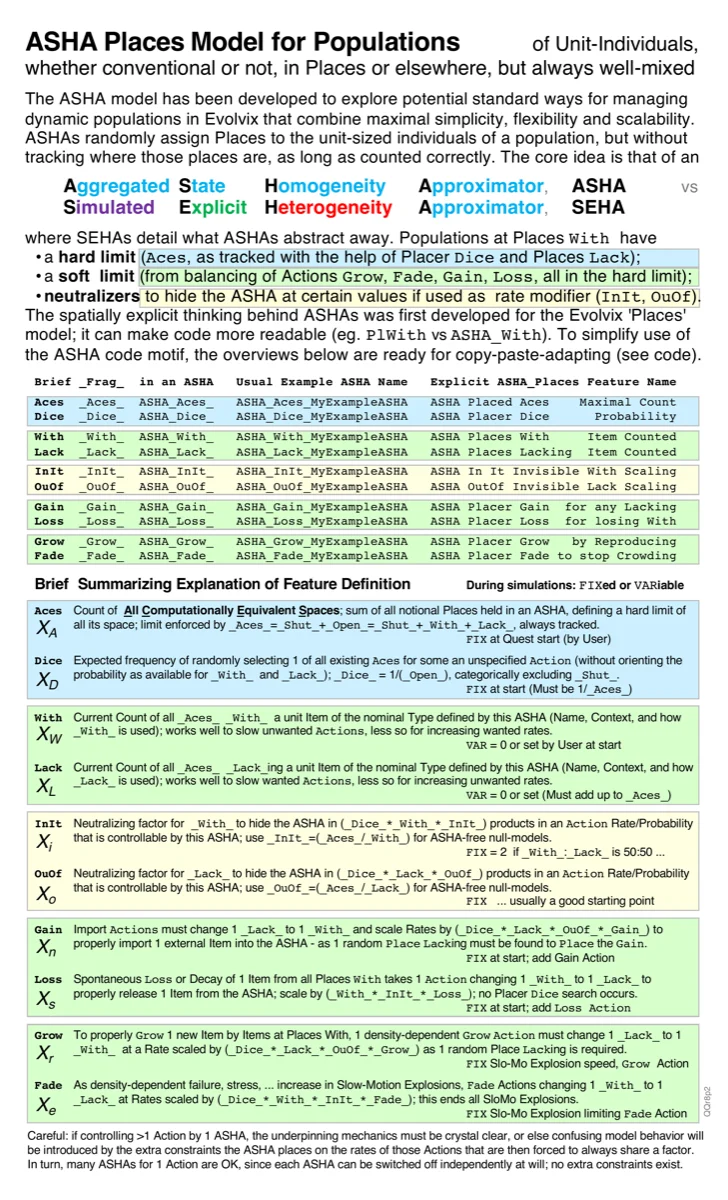
Figure 2 shows how Evolvix Actions define the elementary events that move time forward in the model: the required individual Parts collide (if they exist) to make an Action happen; then they instantly disappear to produce new Parts. The specified Rates for an action are all multiplied together to define it’s propensity to happen next (in a stochastic system, where the individuality of Parts cannot be sliced up; there dice are rolled to find the next Action and when it will occur; in contrast, in deterministic simulations the time-steps forward are given as primary and the number of Parts is sliced up instead, see Ehlert&Loewe 2014 for an introduction to how these approaches contrast). This is the standard mass-action kinetics formalism, but expressed in a declarative syntax that makes the biology more explicit rather than in hard-to-read differential equations. Figure 3 shows how ASHAs extend this by assigning Places to unit-sized individuals in a population, tracking how many Places are With or Lacking a given item (e.g., virus contamination), out of a fixed total number of Aces. This provides ten tunable parameters per ASHA (Aces, Dice, With, Lack, InIt, OuOf, Gain, Loss, Grow, Fade) that control density-dependent dynamics with explicit biological meaning — in contrast to the single composite parameters (like carrying capacity K) that Mallet (2012) [Mallet, 2012] showed can obscure critical biological distinctions. The full ASHA specification is in the Supplementary Evolvix code; Figures 2 and 3 provide the visual guide for reading that code.
Virus particles are classified as either Fragile (decaying quickly, e.g., airborne droplets) or Durable (persisting longer, e.g., surface contamination), each tracked by its own ASHA instance. Each infected individual in each infection stage contributes to viral shedding at stage-specific rates.
Simplified testing laboratory. The model includes a simplified testing pathway where 100% of individuals are tested at entry into Infect1Hide and Infect3Mild stages. This design is deliberately simplified to explore the phenomenon of linear fooling (see Results) rather than to model realistic testing capacity.
Hospital system. Individuals reaching Infect4StrongHOS and beyond are assumed to receive hospital care. The model tracks hospital and ICU occupancy and distinguishes between deaths occurring before hospital admission and deaths in hospital.
2.3 Scenarios and Parameters#
Scenario 1 (Uncontrolled, 2020m02d14): 16 infected individuals in a population of 330 million (US). No behavioral change, no interventions. Virus transmission parameters reflect baseline SARS-CoV-2 characteristics. This scenario calibrates to the observed US doubling time of approximately 3.25 days in the early phase and approximately 4.8 days as measured from model output.
Scenario 2 (NPI-Modified, 2020m05d17): Starting from 1.5 million infections in a population of 330 million, with three sub-options:
Option A: No change in Shed, Decay, or Catch rates (baseline). The pandemic continues as in Scenario 1.
Option B: 50% reduction in either the probability of virus Decay or Catch. This represents partial NPI adoption (e.g., widespread but imperfect masking).
Option C: 50% reduction in both Decay probability and Catch probability simultaneously. This represents coordinated NPI adoption combining masks, hygiene, ventilation, and distancing.
The full model specification, including all parameter values and ASHA configurations, is available as Supplementary Material (Evolvix source code, ~3,900 lines).
3. Results#
3.1 Scenario 1: Anatomy of an Uncontrolled Pandemic#
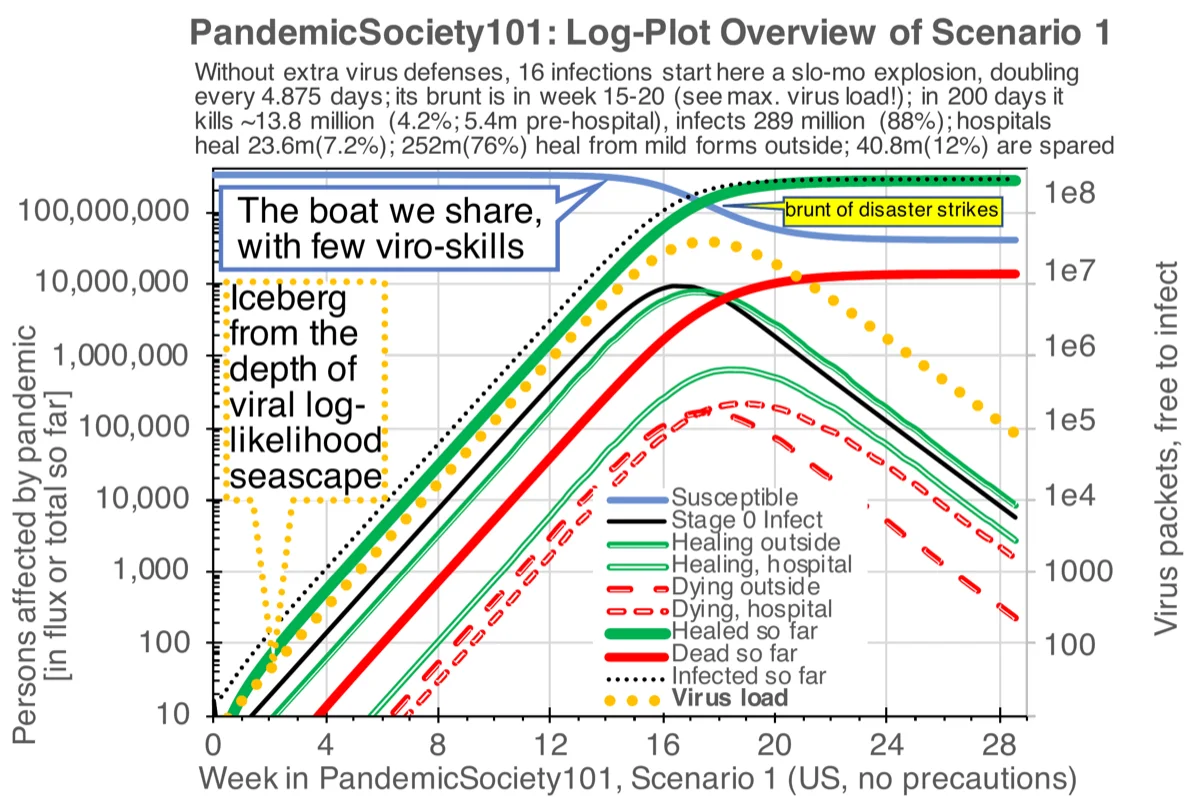
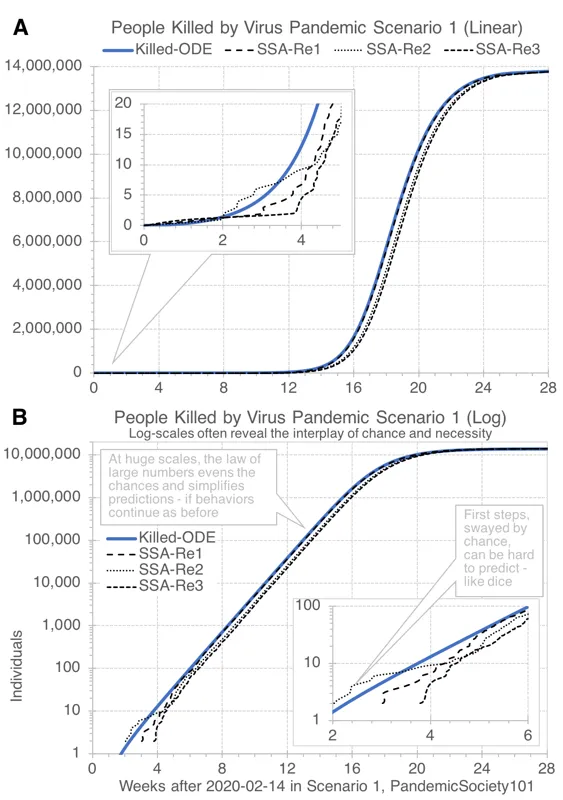
Without interventions, the PandemicSociety101 model produces a pandemic that infects approximately 289 million people (88% of the 330 million population) and kills approximately 13.8 million (4.2% overall; 5.4 million pre-hospital, with 23.6 million (7.2%) healing in hospital and 252 million (76%) recovering from mild forms outside hospitals). Approximately 40.8 million (12%) are spared infection entirely.
The pandemic dynamics exhibit the characteristic exponential growth phase visible on a log scale (Figure 4), where the virus load “iceberg” drives infection rates upward while remaining invisible on linear scales. A critical observation is that on a linear scale, the virus appears to do “almost nothing” during the period when it is most active (Figure 5). By the time infections become visible on a linear plot, the exponential phase is nearly complete. This linear-vs-logarithmic perception gap is a fundamental barrier to public understanding of pandemic dynamics.
Three stochastic simulation replicates (SSA) closely track the deterministic ODE solution (Figure 5). confirming that for a population of 330 million, stochastic effects are minimal except during the earliest phase (when infection counts are small enough for chance to matter).
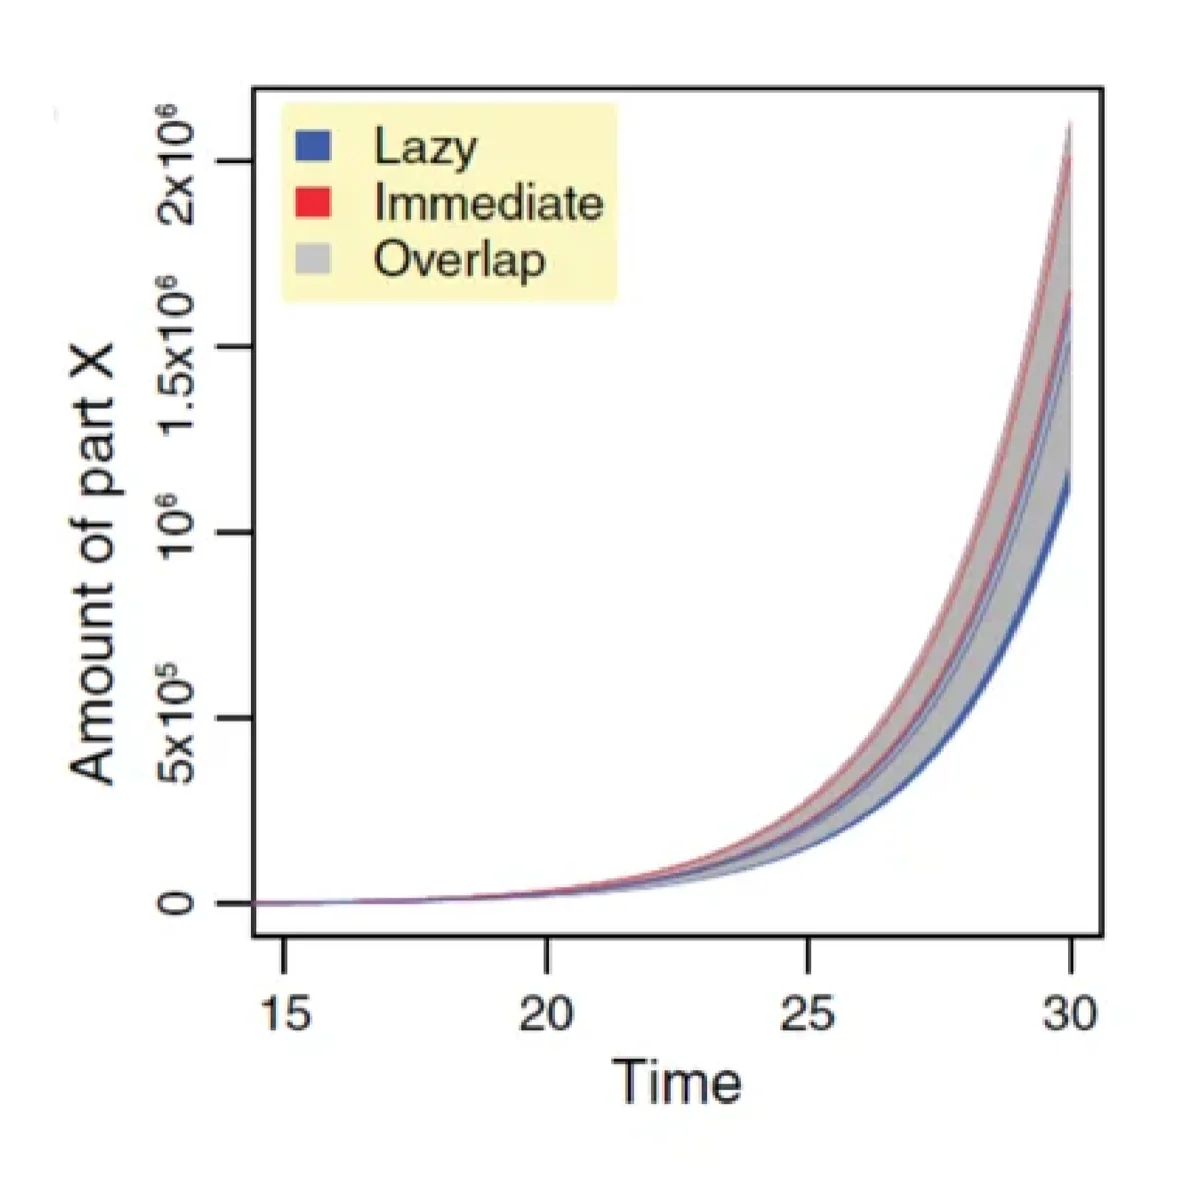
Fig. 6: Exponential growth fooling ([Ehlert and Loewe, 2014]). Full PDF#
How even experienced modelers can be fooled. Figure 6 ( FIG2b) illustrates a sobering point about the deceptive nature of exponential growth on linear scales. This figure, from Loewe’s earlier work on stochastic simulation algorithms (Fig.7a in Ehlert and Loewe, 2014 [Ehlert and Loewe, 2014]), shows 100 stochastic simulations of a simple unbounded exponential growth model starting from 10 individuals. On a linear scale the resulting slow-motion explosion shows the characteristic “hockey stick” pattern: the population appears invisible for a long time, then suddenly explodes. These simulations were produced years before COVID-19, and Loewe had extensive experience interpreting such systems that are much better understood on multiplicative log-scales. Yet when he read US reports of 16 coronavirus infections on 2020m02d15 — a number strikingly close to the 10 individuals that reliably triggered well-defined exponential growth in his 2014 simulations — he failed to realize the significance of that alarming information. If the linear scale’s ability to make exponential processes look like “nothing is happening” fooled even a researcher whose professional work centered on exactly these dynamics, what chances do others have who live much more in the linear world. This personal experience underscores the systemic nature of linear fooling: it is not a failure of knowledge but a failure of perception that affects everyone, including even those who should know better.
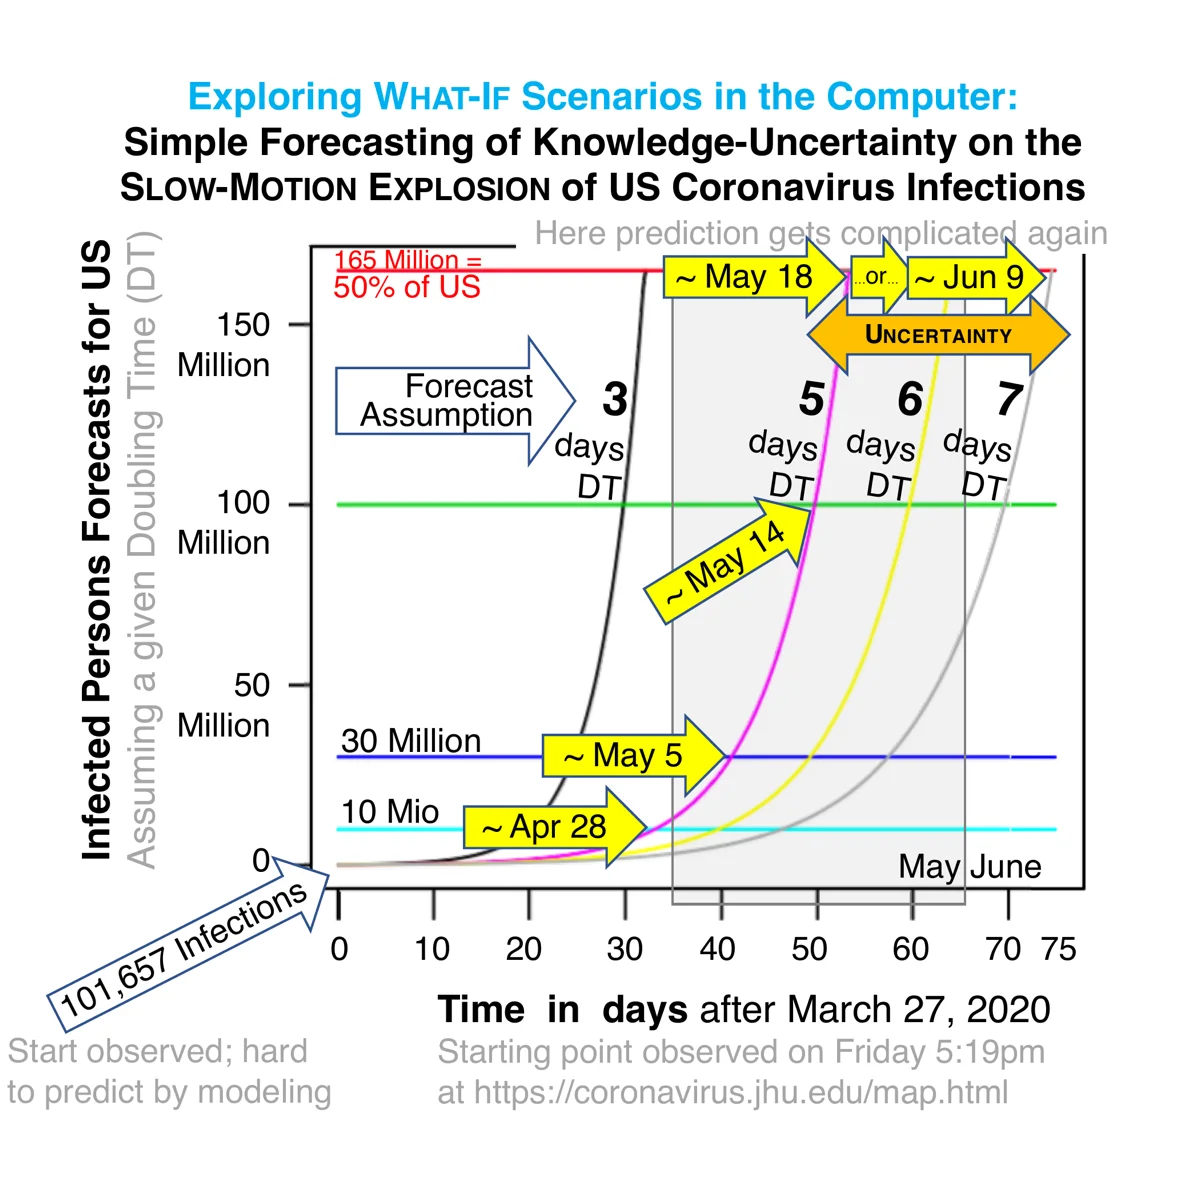
HalfMax method. Here we propose a quick rule-of-thumb method that only needs a pocket calculator for helping a broader audience without access to sophisticated simulation models to quickly translate a reported doubling time T Doubling into an expected waiting time before the brunt of a pandemic will hit — if nothing changes, i.e. rates stay as they are and a random mixing population without changes in behavior can be assumed. The HalfMax method is not about precision; it’s about triaging whether an emergency response is needed and how much time may remain to organize it.
It builds on the basic understanding that all pandemics are slow-motion explosions that follow the logistic growth curve, which predicts that growth will be fastest at half of the maximal capacity, before it starts to slow down again.
This allows for a simple doubling-time arithmetic to estimate the HalfMax point when 50% of the population will be infected and hence infection rates will be highest before they naturally slow down as susceptible individuals get increasingly rare.
The point in having such a simple “pandemic count-down” timer at hand is in distributing as best possible the work required to increase Gaps of Germs such that the overall size of the pandemic can be reduced before it is too late. Interventions after the half-max point will have significantly less impact and their effectiveness may be difficult to distinguish from an expected natural decline in infection numbers.
If everyone can calculate it, everyone can help to reduce it. If it only takes a pocket calculator, the HalfMax waiting-time forecast of T HalfMax becomes easily implementable and checkable where it matters most: at places of decision, where behavioral recommendations are made that affect the Gap of Germs. If a rational explanation is given and people can check it, a given mitigation strategy that requires some sacrifices is much more likely to succeed.
Hence, the value is not in precise point estimate; a min-max range should always be given. The greatest value of the HalfMax method is in helping to reduce the ‘blind faith’ that many felt was required of them during this pandemic.
The core equation is:
T HalfMax ≈ T Doubling × log 2 ( N HalfMax / N NowInfected ) (Eq.1),
where N HalfMax is half the number of all susceptible individuals (~165 million in the US) and N NowInfected approximates how many have already been infected by now.
The purpose is to quickly translate a key observable (like a 5-day doubling time) into actionable intelligence offered by a rough early-warning forecast. It can be thought of as a Tsunami early-warning system, only for pandemics.
Applying it to his own situation in 2020, Loewe calculated the following numbers as reported in Figure 7:
T HalfMax ≈ 32 - 75 days ≈ 3-7 days × log2 [ 165 mio / 0.1 mio ] (Eq.2),
with a point estimate of T Doubling ≈ 5 days forecasting ≈ 53 days after 2020m03d27, the day Loewe started to take his first serious look at the Coronavirus pandemic (with 101,657 reported infections).
These forecasts assumed no changes in behavior whatsoever and continued random mixing. As well known, drastic changes in behavior occurred. To examine the usefulness of the HalfMax method given such changes, its forecasts were compared to actual CDC data through May 2020 (Figure 8).
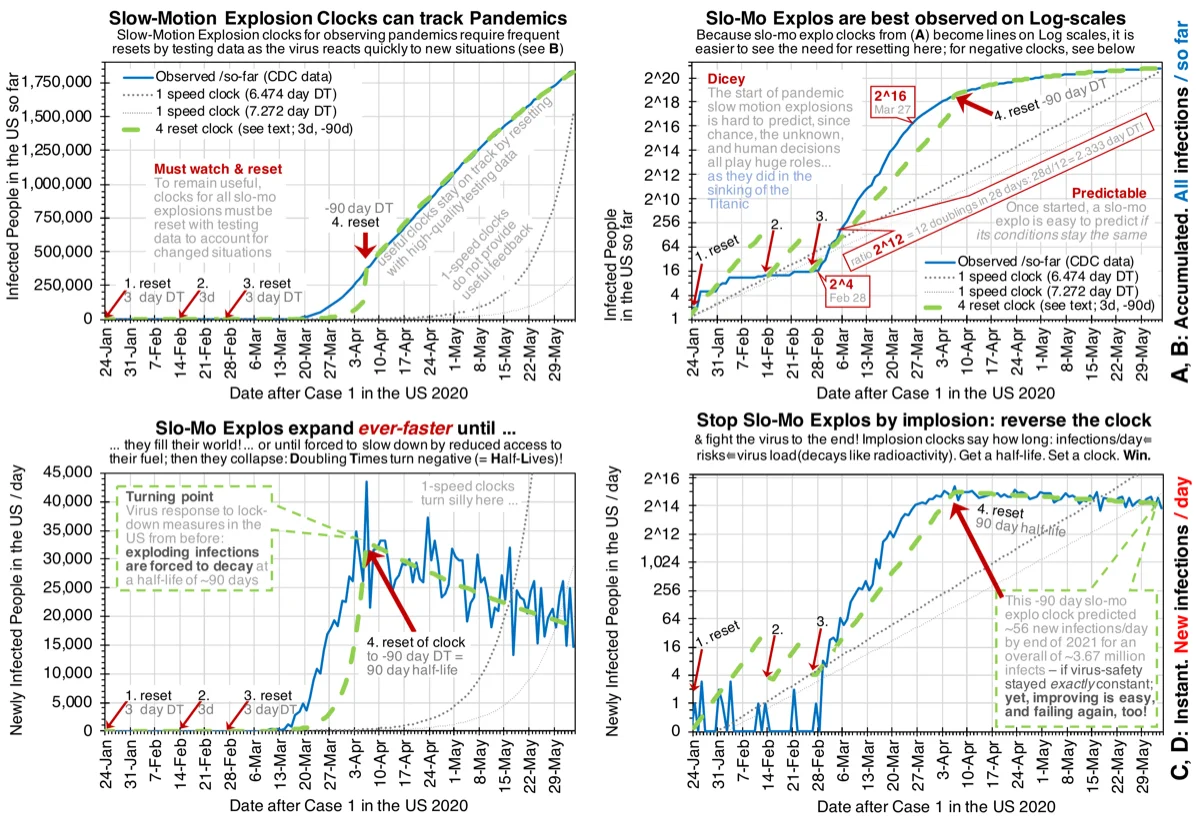
This shows that the observed trajectory is predicted in useful ways between bounds where the HalfMax clock is repeatedly reset to account for observed changes, such as in behavior that affects the Gap of Germs.
3.2 Scenario 2: Stopping the Pandemic with NPIs#
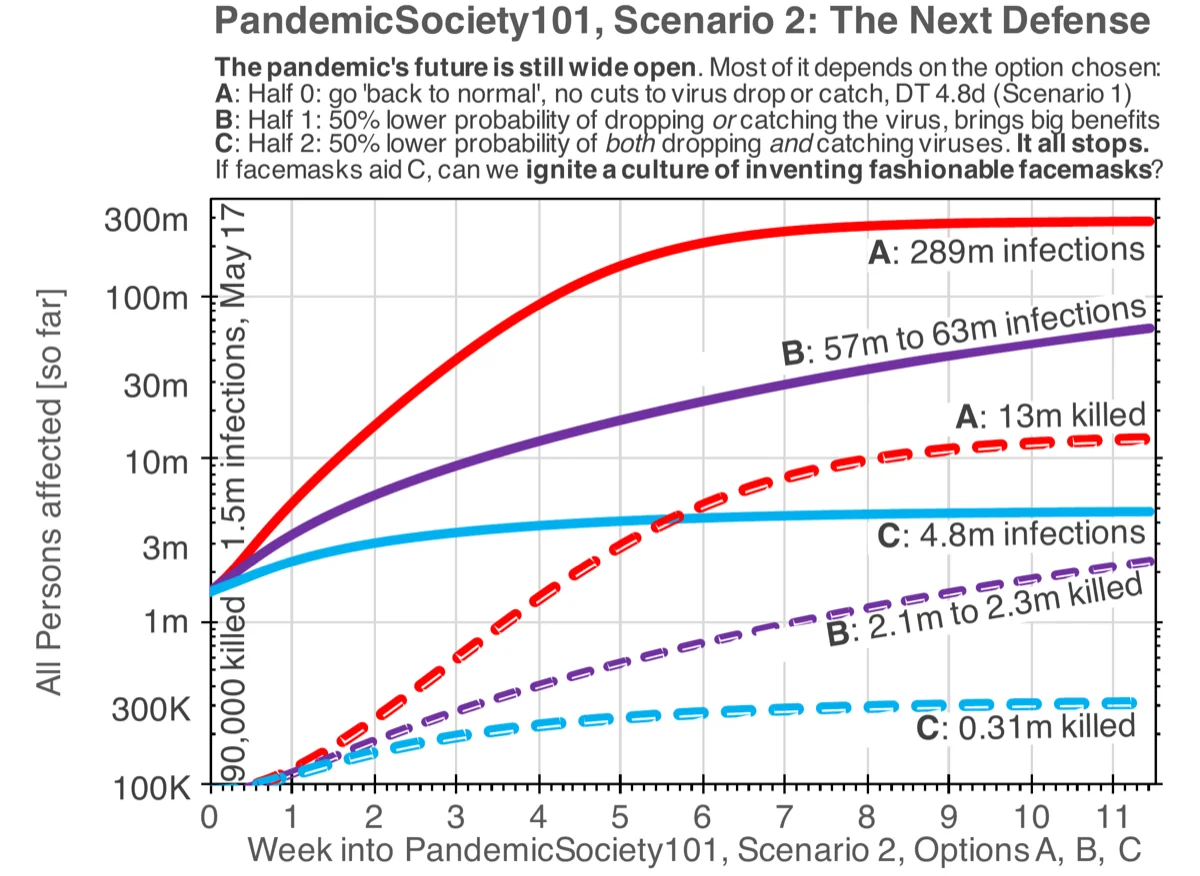
The central result of this study is shown in Figure 9: starting from 1.5 million infections on 2020m05d17, the three NPI options produce dramatically different outcomes:
Option |
Total Infections |
Total Deaths |
NPI Description |
|---|---|---|---|
A |
~289 million |
~13 million |
No change (baseline) |
B |
57–63 million |
2.1–2.3 million |
50% reduction in Shed OR Catch rates |
C |
~4.8 million |
~310,000 |
50% reduction in BOTH Shed AND Catch rates |
The progression from A to B to C demonstrates the multiplicative compounding effect of combining interventions. A single 50% reduction in Shed OR Catch rates (Option B) achieves a 4.6–5.1-fold reduction in infections. Combining both 50% reductions (Option C) achieves a 60-fold reduction — far more than simple linear intuition would predict from doubling the intervention.
Multiplicative compounding is the quantitative foundation for the Gap of Germs concept. However, the explicit modeling of density-dependent effects due to the Gap of Germs as tracked by the ASHA framework goes further. This is the reason for why even without intervention the pandemic in this SGIR model does not approximate 100% infection: eventually the probability of getting enough germs across the gap becomes so low that it can no longer reach the remaining Susceptibles. The non-pharmaceutical interventions that increase the Gap of Germs as reported in Table 1 simply lower that probability enough, such that the pandemic “simply goes away”.
These results are consistent with independent modeling by Stutt et al. (2020) [Stutt et al., 2020], who showed that facemasks combined with lockdown measures could effectively manage the pandemic when adopted broadly. Our SGIR framework provides a mechanistic explanation for why such combinations are so effective: the multiplicative compounding through the Gap of Germs.
This appears to be a case where independently working together is greatly rewarded by the mathematics underpinning the reality of pandemics: those who wear a mask while infected reduce their Shed-rate for the benefit of everyone. However, those who also wear a mask despite not being infected, will reduce their Catch-rate. When both work together, their combined reward in safety gets a mathematical extra-safety bonus, simply for working together.
Hence, despite reducing the product of Shed and Catch probabilities only by four when cutting both probabilities by half, the overall effect is amplified into the observed 60-fold overall reduction by the density-dependent effects tracked by the ASHA framework.
The original 2020 caption of Figure 9 states: “This fool’s hope would not exist if it was impossible to show for biologically reasonable parameter combinations in Model 3 that seemingly realistic manipulations of probabilities for shedding, decaying, or catching the virus could actually stop the pandemic.” What happened to that fool’s hope and why it existed in the first place are topics beyond the scope of this study and require in-depth analyses of many other topics.
3.3 Linear Fooling: A Dangerous Cognitive Trap#
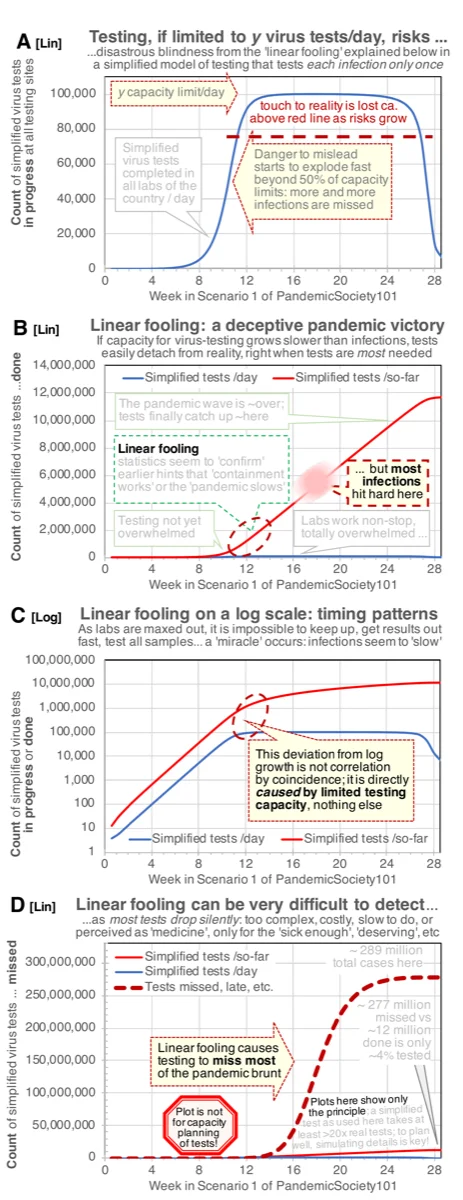
The model’s simplified testing laboratory reveals a phenomenon we term linear fooling (Figure 10). When testing capacity is limited to a fixed number of tests per day, the following sequence occurs:
Early phase: Testing capacity exceeds demand. All infections are detected. Statistics appear reliable.
Transition: Infections grow exponentially and eventually exceed testing capacity. From this point, testing detects a constant number of infections per day (the capacity limit), regardless of actual growth.
Misleading plateau: On a linear plot, daily confirmed cases appear to stabilize or even decline, creating the illusion that “containment is working” precisely when infections are growing fastest.
Sudden revelation: When the pandemic wave passes and testing capacity again exceeds demand, the true scale of missed infections becomes apparent — but by then the damage is done.
The linear fooling effect is not a bug in testing strategy; it is a mathematical consequence of limited capacity encountering exponential growth. It is disastrously easy to fall for because it confirms a desirable narrative (the pandemic is under control) at precisely the moment when vigilance is most needed.
On a log scale, the effect is clearly visible as a deviation from exponential growth in the testing curve (Figure 10C), but most public health dashboards display data on linear scales, where the deviation is invisible.
A note on potential misuse. Linear fooling does NOT mean that testing is useless — it means that testing must be scaled to match exponential growth, and that public health dashboards should routinely display data on logarithmic scales where the limits of testing capacity become immediately visible. The point is not that “the numbers were fake” but that limited capacity creates a structural blind spot that affects everyone, including decision-makers acting in good faith. Awareness of this structural trap is the first step toward designing testing infrastructure that remains informative even during exponential surges.
3.4 Death Rate Dynamics: Another Form of Fooling#
The model reveals a second form of “fooling” that complements linear fooling: the apparent death rate changes dramatically throughout the pandemic depending on when and how it is measured, even though the model assumes constant best available care at all stages (no healthcare system collapse).
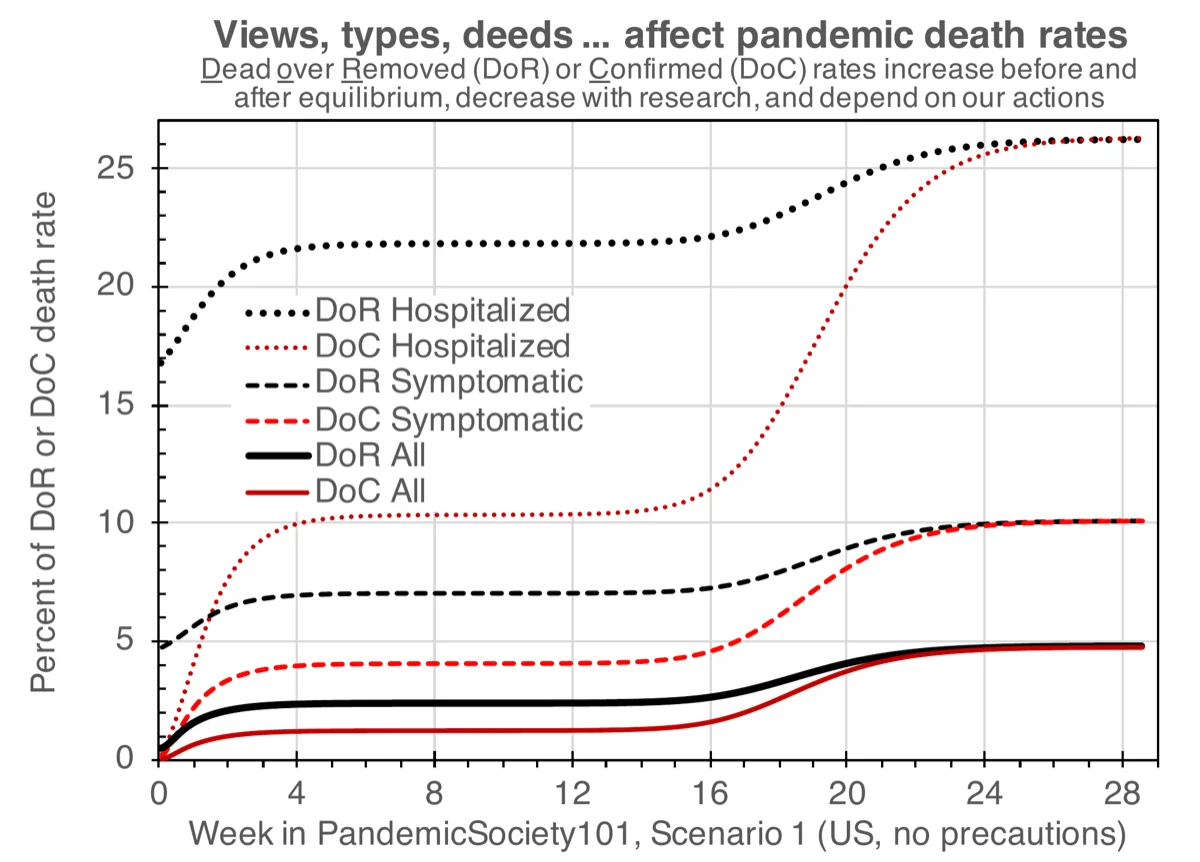
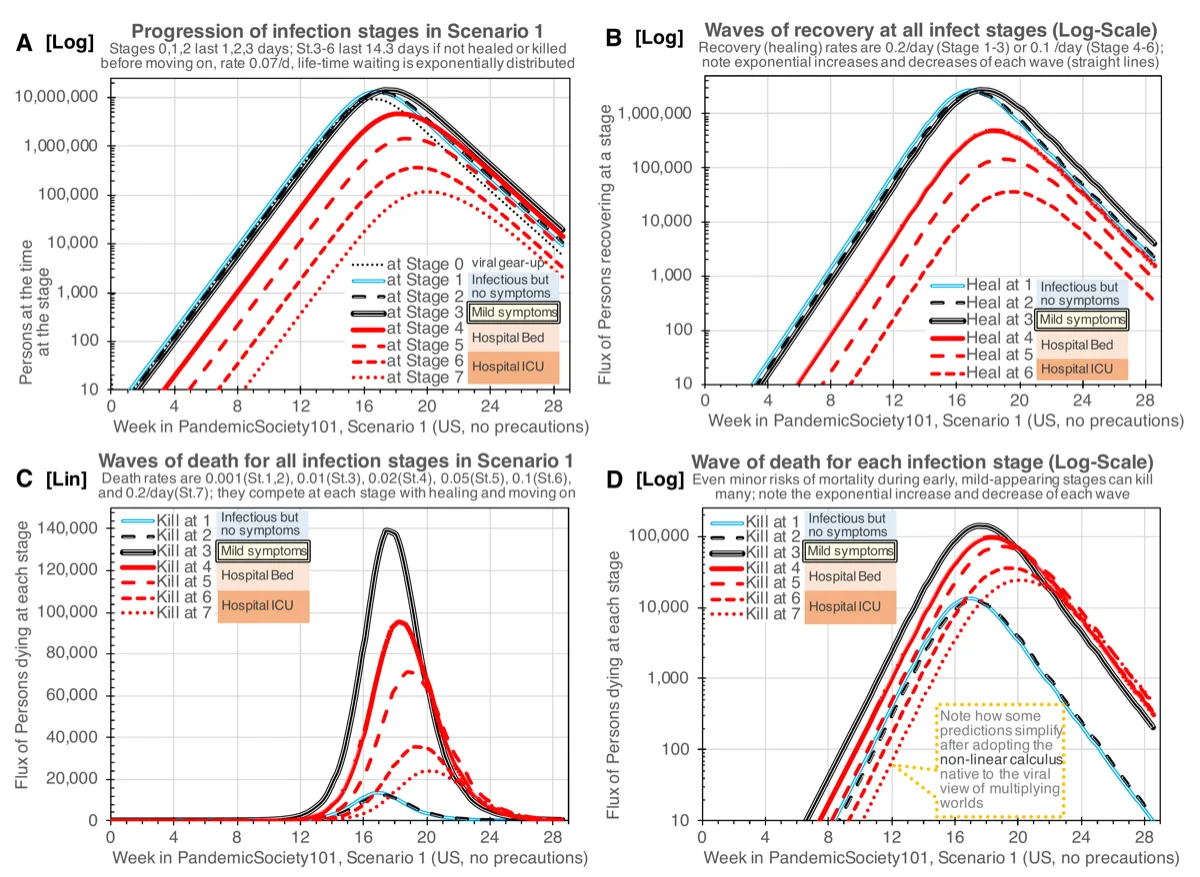
The model’s overall IFR is not an input parameter — it is an emergent property of the stage-specific death, healing, and progression rates competing at each stage. Figure 11 plots several observable death rate measures over time:
Measure |
Definition |
What it shows in the model |
|---|---|---|
DoC All |
Dead (so far) / Confirmed (so far) |
Starts near ~1% in weeks 4–16, then rises to ~4.8%. Closest to early-pandemic IFR estimates. The rise is a timing artifact: deaths lag behind confirmations. |
DoR All |
Dead / (Dead + Recovered) |
Starts near ~2%, rises to ~5%. Similar timing dynamics. |
DoC Symptomatic |
Dead / Confirmed (stage 3+) |
~4% in weeks 4–16, rising to ~10%. Higher because pre-symptomatic stages are excluded from denominator. |
DoR Symptomatic |
Dead / Removed (stage 3+) |
~7% equilibrium, rising to ~10%. |
DoC Hospitalized |
Dead (so far) / Confirmed (stage 4+, so far) |
Starts near ~10%, rises to ~26%. Ratio of deaths over confirmed hospitalized cases. Timing artifact strongest here. |
DoR Hospitalized |
Dead / Removed (stage 4+) |
~22% equilibrium, rising to ~26%. Ratio among hospitalized patients only — does NOT represent overall population death rate. |
The key insight: all these measures change over time even though the model’s underlying rates are constant. The rising trajectories are caused by the timing mismatch between infection confirmation and death: during exponential growth, most confirmed cases have not yet reached their final outcome, making the apparent death rate misleadingly low. After the wave passes, the accounting catches up.
This timing mismatch is itself a form of “fooling” complementary to linear fooling: just as limited testing creates an illusion of pandemic control, the timing delay in death statistics creates an illusion that the pandemic is less deadly than it actually is during its most active phase.
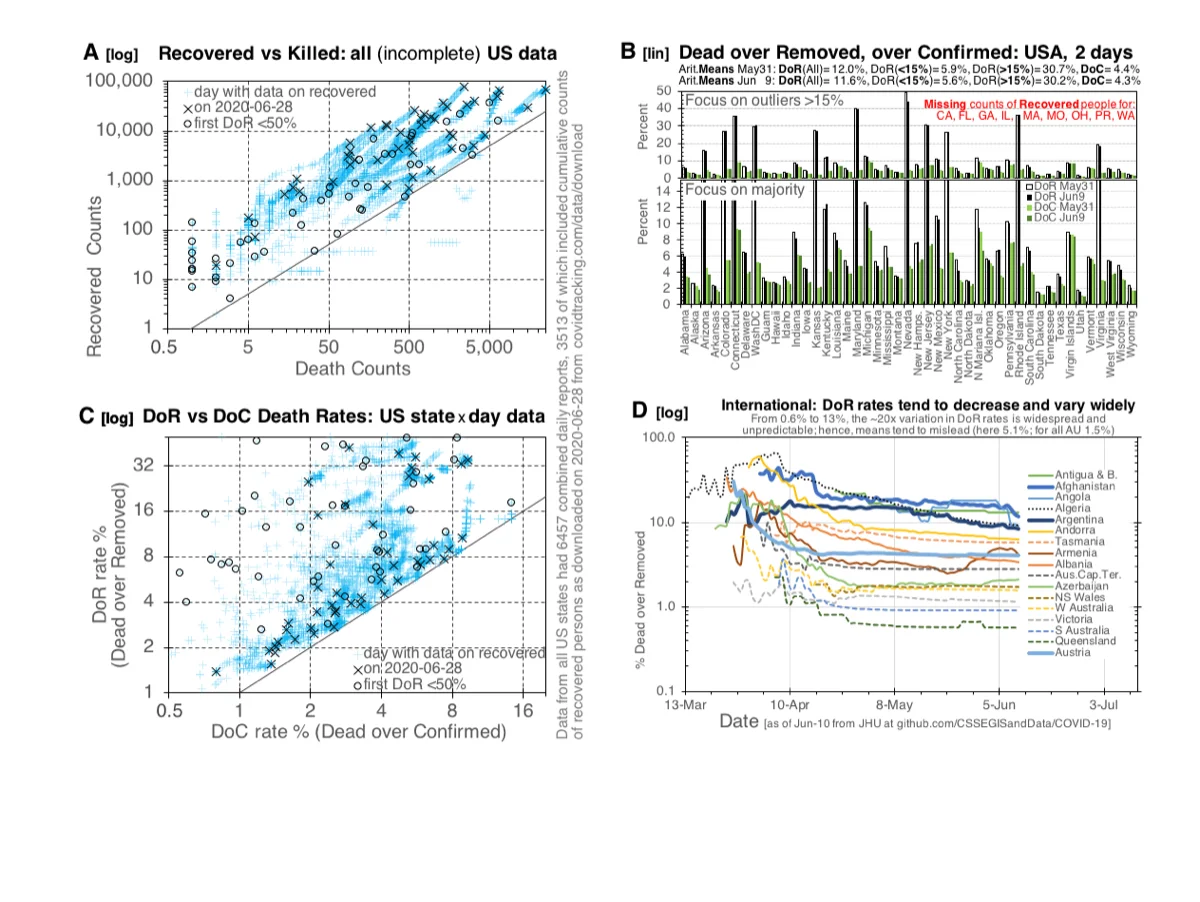
The model’s death rate parameters were calibrated to data available in early-to-mid 2020, when observed death rates were substantially higher and more uncertain than later estimates. Figure 12 documents this empirical fog: as of 2020m06d28, US state-level Dead-over-Removed rates ranged from <5% to >40%, while international rates varied ~20-fold (0.6% to 13%). The model’s parameters represent a good-faith effort to capture the threat as it was understood at the time.
4. Discussion#
4.1 The Gap of Germs as an Actionable Framework#
The SGIR model reframes pandemic defense around a single concept: increase the Gap of Germs. Every NPI — masks, distancing, ventilation, hand hygiene, surface cleaning — acts by increasing one or more components of the Gap. This reframing has several advantages over the traditional focus on the reproduction number R0:
Mechanistic clarity: R0 is an aggregate outcome; the Gap identifies the specific levers (Shed, Decay, Catch) that humans can manipulate.
Additive intuition: While transmission compounds multiplicatively (which is non-intuitive), the Gap can be communicated additively: “do three small things and the combined effect is large.”
Social justice connection: Crowding, poverty, and inadequate housing shrink the Gap. Investments in equitable living conditions are simultaneously investments in pandemic defense.
Reusable value: Unlike vaccines or antivirals, Gap-increasing measures (better ventilation, more living space, hygiene infrastructure) provide benefits even when no pandemic is active while simultaneously guarding against yet unknown pandemic threats.
4.2 Limitations#
Several limitations must be noted:
Simplified testing model. The 100% testing at stage transitions is unrealistic. It was designed to isolate the linear fooling phenomenon, not to model realistic testing capacity. A more realistic testing model would need probabilistic testing, limited capacity, and delays.
Homogeneous mixing. The current model assumes well-mixed populations. Real populations have spatial structure, contact networks, and heterogeneous behavior. The ASHA framework provides hooks for density-dependent effects, but the current implementation does not model spatial heterogeneity across distinct geographic areas.
Behavioral diversity. Scenarios assume fixed NPI levels. In reality, human behavior changes dynamically in response to perceived risk, official guidelines, and fatigue. Modeling adaptive behavior is an important extension.
Parameter uncertainty. While the model is calibrated to observed US doubling times, many parameters (e.g., stage-specific shedding rates, fraction progressing to severe disease) carry substantial uncertainty. The qualitative result (small NPI changes produce large effects through multiplicative compounding) is robust to parameter variation, but the specific numbers (4.8 million vs. 289 million) depend on parameter choices.
No vaccination. The model does not include vaccination, which became the dominant intervention in 2021. The model’s contribution is to the pre-vaccine question: could coordinated NPIs alone have stopped the pandemic?
R0 in SGIR models. If one were to track the classical R0 parameter in these SGIR models, it would change over time as the Gap of Germs changes. This is trivially true from observations (behavioral changes alter transmission), but calculating R0 in a principled way for complex density-dependent models is exceedingly difficult — comparable to the challenge of estimating effective population size Ne in population genetics. The SGIR framework sidesteps this by focusing on the mechanistic levers (Shed, Decay, Catch) rather than the aggregate outcome (R0).
Infection fatality rate (IFR). The model’s overall IFR of ~4.8% (Scenario 1) is higher than later COVID-19 IFR estimates (~0.5–1.3%; [Meyerowitz-Katz and Merone, 2020]). This is an emergent property of the model’s stage-specific rates, not an input. The model assumes constant best available care (no healthcare collapse). The apparent discrepancy is explained by timing dynamics (Section 3.4) and by calibration to early-2020 data when observed death rates were much higher and more uncertain (Figure 12). See Section 3.4 for the full analysis.
US-specific calibration. The model is calibrated to US population (330 million), US doubling times, and an implicit US-style hospital system. The qualitative results (multiplicative NPI compounding, linear fooling) apply universally, but the specific numbers would differ in settings with different population densities, healthcare capacities, and NPI adoption patterns. Extending the model to non-US settings is planned as future work.
Sensitivity analysis. A systematic parameter sensitivity analysis is planned but beyond the scope of this initial report. The qualitative robustness of the multiplicative compounding result — that combining independent NPI reductions compounds their effects super-additively — follows from the mathematical structure of density-dependent mass-action kinetics and does not depend on specific parameter values. The specific 60-fold number, however, will vary with parameters and should be interpreted as demonstrating the magnitude of the effect rather than as a precise prediction.
4.3 Implications for Pandemic Preparedness#
The 60-fold reduction achieved by Option C in Scenario 2 suggests that coordinated NPI adoption — even without vaccines — could have dramatically altered the COVID-19 trajectory. The key word is coordinated: Option B (one intervention at 50%) achieves only a 5-fold reduction, while Option C (two interventions at 50% each) achieves 60-fold. The difference is not additive but multiplicative, and the additional density-dependent effects tracked by the ASHA framework amplify it further.
This has implications for future pandemic preparedness. If a novel respiratory pathogen emerges for which no vaccine exists, the question becomes: can societies coordinate NPI adoption quickly and broadly enough to exploit the multiplicative compounding effect? The answer depends not on virology but on social organization, communication, trust, and logistics — precisely the factors that vary most across countries and that proved most difficult during COVID-19.
The linear fooling phenomenon compounds this challenge. If limited testing capacity creates an illusion of control during the critical early phase, decision-makers may relax NPIs prematurely, losing the window in which coordinated action could have stopped the pandemic. Awareness of linear fooling and routine use of logarithmic displays in public health dashboards could help mitigate this risk.
4.4 Beyond This Model: Coordination, Infrastructure, and the Road Ahead#
The Scenario 2 results raise an obvious question: if coordinated NPIs can produce a 60-fold reduction, why was coordination so difficult during COVID-19? This question — and the six years between the simulations presented here (2020) and this publication (2026) — deserve a brief answer, with details deferred to companion papers.
Pandemic defense is a logistics problem, not primarily a virology problem. The biological knowledge for reducing Shed, Decay, and Catch rates existed early in the pandemic. What was missing was the organizational infrastructure to translate that knowledge into coordinated behavior change. The author’s subsequent work focused on analyzing why coordination fails, using a framework called work-logic cascades — analogous to signal transduction cascades in molecular biology — that models how individual decisions about virus defense amplify (or are dampened) through organizational levels. This framework, the concept of annual Virodefense Olympics for maintaining pandemic readiness, the broader ResearchCity vision for sustained global research infrastructure, and lessons learned from using the Evolvix modeling language under pandemic stress are presented in a companion appendix (see Appendix: From Pandemic Modeling to Global Research Infrastructure) and will be developed fully in separate publications.
On funding pandemic preparedness independently: The analysis of coordination failures led to a specific funding design: independent crowd-funded research stadia with a contribution cap of approximately $8 per person per year — roughly two cents a day. This cap is deliberately calibrated to be accessible even at the median income of the world’s poorest countries: the design intent is that everyone can contribute their share toward an institution that is audited to work for everybody, including the weakest. The cap simultaneously keeps large corporate donors at arm’s length, ensuring fiduciary responsibility toward the global public rather than toward special-interest shareholders. Those with greater means are invited to sponsor access for others who cannot yet participate. This model is complementary to, not a replacement for, pharmaceutical research and vaccine development.
5. Conclusions#
The SGIR model provides a mechanistic framework for understanding how non-pharmaceutical interventions stop pandemics by increasing the Gap of Germs between infectious agents and susceptible hosts. Using the PandemicSociety101 stochastic simulation model calibrated to US COVID-19 data, this study shows that:
An uncontrolled pandemic in a population of 330 million can infect 289 million and kill 13 million within months.
A 50% reduction in both Shed and Catch rates — achievable through coordinated use of facemasks, hygiene, and distancing — can stop the same pandemic at 4.8 million infections and 310,000 deaths, a 60-fold reduction, even if interventions start relatively late.
The multiplicative compounding of non-pharmacological intervention effects means that combining multiple imperfect interventions produces dramatically larger effects than any single intervention alone.
Linear fooling by limited testing capacity creates dangerous illusions of control during the critical exponential growth phase.
A simple HalfMax method is proposed for acting as an early-warning system for pandemics, not unlike early-warning systems for Tsunamis.
Beyond these direct findings, the analysis suggests several broader implications that merit further investigation:
Effective pandemic defense requires winning back the trust of those who felt rejected by a system of “blind trust” in experts. The HalfMax method and the Gap of Germs framework are designed to make the underlying logic transparent and checkable by anyone.
Pandemic preparedness is ultimately a coordination and logistics problem, not primarily a virology problem. The companion appendix outlines a vision for sustained global infrastructure (work-logic cascades, Virodefense Olympics, ResearchCity) designed to maintain and improve pandemic defense capacity over the long term.
The same dynamics play out at radically different scales. Figure 14 simulates the Scenario 1 outbreak across five orders of magnitude of population: a 1,000-person prison (~43 deaths, 3 stochastic runs giving 33, 44, 45 against the ODE mean), a county of 0.5 million (~21,000 deaths), the USA at 330 million (~13.8 million deaths), and the world at 7.8 billion (~326 million deaths). What changes with scale is not the underlying logic but the relative importance of stochastic variation: at prison scale, individual dice rolls dominate outcomes; at world scale, the Law of Large Numbers smooths individual variation into a deterministic trajectory. This scale-invariance of the mechanism explains both why timely local responses matter (small-scale outbreaks can burn out stochastically OR escape stochastically) and why coordinated global infrastructure matters (large-scale outbreaks follow the deterministic logic the model captures). The infrastructure outlined in the companion appendix (work-logic cascades, Virodefense Olympics, ResearchCity) is designed to deploy both the timely-local and the coordinated-global responses this scale analysis requires.
These results support the case for investing in pandemic preparedness infrastructure that increases the Gap of Germs as a permanent public good, rather than relying solely on reactive measures after a pandemic has begun. The mechanistic framework defined here opens many opportunities for measuring specific rates in specific contexts that can then be modeled to optimize virodefenses.
Supplementary Material#
The complete PandemicSociety101 model is available as an Evolvix source code file (~3,900 lines, version QQ0r8p2_2020m06d20) specifying all Parts, Actions, Rates, initial conditions, and ASHA configurations for all scenarios described in this paper. The model was executed using Evolvix prototype MMs0r3p1, which maps the mass-action model specification to both ODE (Sundials IDAS Dense solver) and SSA (Sorting Direct Method; see Ehlert and Loewe, 2014 [Ehlert and Loewe, 2014]) solvers.
Evolvix compiler availability. Pre-compiled binaries of the Evolvix command-line compiler (version 0.3.1 RC1, 2015m03d11) for Linux (Fedora 21, RHEL 7, Ubuntu 14), Mac OS X 10, and Windows 7 are included with this paper’s supplementary material. The original Evolvix download page (evolvix.org/download) has been archived at the Internet Archive (archive.org). These binaries accept the supplementary Evolvix source code and produce the simulation results reported here. The compiler is a prototype; modernizing it for current operating systems is planned as part of the Evolvix development roadmap (see companion appendix). An explicit writeout of the full ODE system is planned for a companion methods paper; in the interim, the declarative Evolvix source code together with the available compiler constitutes the complete, executable model specification.
Pandemic simulator package. A ready-to-run package containing the Evolvix compiler binary (Mac OS X), the PandemicSociety101 model source code, and instructions for reproducing all figures is available for download: [TODO: ADD LINK to simulator ZIP when prepared]
LLoL review DONE: [The Evolvix code file included with this
draft is the version QQ0r8p2_2020m06d20.
This is the version (or equivalent to the version) that produced the figures in the manuscript.]
Note
Draft and version status.
dv_ClaOp46Max_MMv1_sgir-paper_2026m04d17dv_LLoL_MMv1r1_sgir-paper_2026m04d17 (LLoL edits)dv_ClaOp46Max_MMv1r2_sgir-paper_2026m04d18 (adversarial review revisions)Supplementary#
S.1 Code and Data. The PandemicSociety101 Evolvix model (version
QQ0r8p2, 2020m06d20, ~3,900 lines) is included as supplementary text
linked in the brief Supplementary note above. The Evolvix 0.3.1 RC1
compiler binaries are cited under [Loewe and EvoSysBio Group at UW-Madison, 2015–2026] and preserved via
archive.org. Zenodo DOI deposition for both the model and the compiler
binaries is planned as part of the #AuditTheMath campaign; the
current archive.org mirror is stable but does not provide a
versioned-citable DOI. Data: simulation output (producing
Figures 1–13) are on local storage and have not yet been deposited in
a public archive. Input data (US COVID-19 case counts from 2020) are
publicly available from the Johns Hopkins CSSE repository. Readers
who need simulation output for independent analysis may contact the
author directly in the interim. Full data archival is planned
post-launch.
S.2 Prompts. This paper was drafted with Claude Opus 4.6 assistance (then 4.7) under LLoL’s direction. The adversarial review prompt is at Prompt: Adversarial Review of the SGIR / PandemicSociety101 Paper.
S.3 LLogs. The decision trail behind the paper is at /matheology/hell/ll/study/b/18/study_ll_2026m04d18_sgir-paper-review-llog (7-panel adversarial review with 13 sections and follow-up correction log).
S.4 Reviews. The 7-panel adversarial review (Epidemiologist, Hostile Journalist, Catholic Scientist, NIH-Style, Computational Biology, COVID-Politics, Global South) is fully documented in the review llog above (S.3).
S.5 AI Model Disclosure. Claude Opus 4.6 Max drafted the main
text explaining LLoL’s figures and results from 2020, as directed by
LLoL in 2026. During later revisions (2026m04d19 onward), Claude Opus
4.7 Max was used (see author note 3 in the header). Prompts available
at S.2. HUMANE-protocol limitation: AI engagement is not independent
endorsement. See the Conflict of Interest statement above and the
#AuditTheMath campaign for the recommended remediation (external
human review).
S.6 Correction Log. One notable correction during adversarial review: the IFR attribution to healthcare-system collapse was wrong; the model assumes constant care. LLoL corrected the text; revised Limitation 7 now explains death-rate dynamics via timing mismatch rather than capacity collapse. Full discussion in the review llog §17.
S.7 License. Text: CC-BY 4.0. Code: MIT. Data (where deposited): CC-BY 4.0. Readers may share, adapt, and build on this work with attribution; commercial use is permitted under CC-BY 4.0 and MIT.
See AHA/reproducible-science.md for the ideal-vs-current
reproducibility posture and the #AuditTheMath campaign that will
close remaining gaps (Zenodo deposits, full data archival).
References#
Caplan, Y., Stewart, N., Smittenaar, P., & Sgaier, S. K. (2020). Fighting COVID-19's disproportionate impact on black communities with more precise data. Stanford Social Innovation Review. URL: https://ssir.org/articles/entry/fighting_covid-19s_disproportionate_impact_on_black_communities_with_more_precise_data
Ehlert, K., & Loewe, L. (2014). Lazy updating of hubs can enable more realistic models by speeding up stochastic simulations. Journal of Chemical Physics, 141(20), 204109. URL: https://doi.org/10.1063/1.4901114, doi:10.1063/1.4901114
Ferguson, N. M., Laydon, D., Nedjati-Gilani, G., Imai, N., Ainslie, K., Baguelin, M., … Ghani, A. C. (2020). Impact of non-pharmaceutical interventions (NPIs) to reduce COVID-19 mortality and healthcare demand. Imperial College COVID-19 Response Team.
Giordano, G., Blanchini, F., Bruno, R., Colaneri, P., Di Filippo, A., Di Matteo, A., & Colaneri, M. (2020). Modelling the COVID-19 epidemic and implementation of population-wide interventions in Italy. Nature Medicine, 26(6), 855–860. URL: https://doi.org/10.1038/s41591-020-0883-7, doi:10.1038/s41591-020-0883-7
Kermack, W. O., & McKendrick, A. G. (1927). A contribution to the mathematical theory of epidemics. Proceedings of the Royal Society of London A, 115(772), 700–721. URL: https://doi.org/10.1098/rspa.1927.0118, doi:10.1098/rspa.1927.0118
Kissler, S. M., Tedijanto, C., Goldstein, E., Grad, Y. H., & Lipsitch, M. (2020). Projecting the transmission dynamics of SARS-CoV-2 through the postpandemic period. Science, 368(6493), 860–868. URL: https://doi.org/10.1126/science.abb5793, doi:10.1126/science.abb5793
Loewe, L., & EvoSysBio Group at UW-Madison (2015–2026). Prototype Evolvix: A Domain-Specific Language and Compiler to Simplify Accurate Mass-Action Modeling in Biology — Simulating Systems where Parts randomly meet to trigger Actions at defined Rates.
Mallet, J. (2012). The struggle for existence: how the notion of carrying capacity, k, obscures the links between demography, Darwinian evolution, and speciation. Evolutionary Ecology Research, 14, 627–665. URL: https://mallet.oeb.harvard.edu/files/malletlab/files/mallet_the_struggle_2012_kindle.pdf
Meyerowitz-Katz, G., & Merone, L. (2020). A systematic review and meta-analysis of published research data on COVID-19 infection fatality rates. International Journal of Infectious Diseases, 101, 138–148. URL: https://doi.org/10.1016/j.ijid.2020.09.1464, doi:10.1016/j.ijid.2020.09.1464
Mosley, T. J., Zajdel, R. A., Alderete, E., Clayton, J. A., Heidari, S., Pérez-Stable, E. J., … Bernard, M. A. (2025). Intersectionality and diversity, equity, and inclusion in the healthcare and scientific workforces. Lancet Regional Health — Americas, 41, 100973. URL: https://doi.org/10.1016/j.lana.2024.100973, doi:10.1016/j.lana.2024.100973
Stutt, R. O. J. H., Retkute, R., Bradley, M., Gilligan, C. A., & Colvin, J. (2020). A modelling framework to assess the likely effectiveness of facemasks in combination with `lock-down' in managing the COVID-19 pandemic. Proceedings of the Royal Society A, 476(2238), 20200376. URL: https://doi.org/10.1098/rspa.2020.0376, doi:10.1098/rspa.2020.0376
Talic, S., Shah, S., Wild, H., Gasevic, D., Maharaj, A., Ademi, Z., … Ilic, D. (2021). Effectiveness of public health measures in reducing the incidence of COVID-19, SARS-CoV-2 transmission, and COVID-19 mortality: systematic review and meta-analysis. BMJ, 375, e068302. URL: https://doi.org/10.1136/bmj-2021-068302, doi:10.1136/bmj-2021-068302
Figure Downloads#
All figures originate from the companion document “EvoSysBio, Evolvix, and World War V against Coronaviruses” (Loewe, 2020m07d17, 32 pp) unless otherwise noted. Figures appear inline near their first reference in the text; this section provides download links for all figures.
Fig. |
Title |
Download |
|---|---|---|
1 |
Core model of PandemicSociety101 |
|
2 |
Evolvix Actions |
|
3 |
ASHA Places Model |
|
4 |
Log-plot overview, Scenario 1 |
|
5 |
Deaths in Scenario 1 |
|
6 |
Exponential growth fooling |
|
7 |
HalfMax forecasting |
|
8 |
Slow-motion explosion clocks vs CDC data |
|
9 |
Stopping the pandemic with NPIs (Scenario 2) |
|
10 |
Linear fooling by limited testing |
|
11 |
Death rate dynamics (DoR/DoC over time) |
|
12 |
Empirical death rate variation (2020m06d28) |
|
13 |
Stage-specific infection, recovery, and death waves |
|
14 |
Slow-motion explosions at five scales (prison → county → USA → world) |
|
A1 |
Work-logic cascade (see companion appendix) |
|
A2 |
MAPK signal cascades (see companion appendix) |
|
A3 |
Places of Reasoning (see companion appendix) |
Companion papers
Appendix: From Pandemic Modeling to Global Research Infrastructure — companion appendix: work-logic cascades, MAPK analogy, pandemic-to-existential bridge, Virodefense Olympics / ResearchCity, $8 funding rationale, Evolvix lessons.
b18 Overview — All Call-to-Action Material in One Concentrated Place (2026m04d19_21h08) — b18 overview (Call to Action: From MAD to MAP) in the Matheo series; the SGIR paper is the most tractable test case for the infrastructure needs b18 argues for.
AAA — HEAVEN Study Series (AnyAllArrival) — AAA QuickRef for the full HEAVEN study series (b11–b18).
HELL: internal production files — Historically Experienced Lessons Learned (there be dragons)
The following are internal production files recorded to help remember Historically Experienced Lessons Learned (HELL): BEWARE, for content may be rough, early draft-quality, or outdated and hence misleading if taken out of historic context. There be dragons.
Prompt: Adversarial Review of the SGIR / PandemicSociety101 Paper — adversarial review prompt (7 panels).
/matheology/hell/ll/study/b/18/study_ll_2026m04d18_sgir-paper-review-llog — full adversarial review llog (1317 lines, 18 sections, including §17 IFR correction).
AA b16: SGIR (b19) paper finalization tasks — AnyAims task list from the review, including deferred items (buy-in equity discussion, sensitivity analysis, non-US scenario, appendix decision, literature review, ODE writeout).