Stopping a Pandemic in Mid-Flight: SGIR Models Show How Small Increases in Germ Gaps Can Avert Mass Casualties#
Broader Significance
Pandemics are arguably on the more tractable end of the civilizational-scale threats that humanity faces today. Unlike nuclear risks or climate change, a respiratory pandemic plays out on a timescale where coordinated behavior change — masks, ventilation, distancing — can measurably alter outcomes within weeks.
The main scientific result of this study is a mechanistic forecast of a 42-fold reduction in deaths caused by modest coordinated actions that increase Germ Gaps. Yet, such coordination requires overcoming a wide range of cognitive traps, some of which directly obscure a pandemic trajectory from inside a pandemic. This study discusses some of these blind-spots under the label of “linear fooling” to help find strategies for overcoming them. The deeper message is that there currently exists no infrastructure for explaining relevant virodefense mechanisms nor for deploying the gentle kind reasonable coordination required to stop a pandemic.
Readers concerned with pandemic preparedness, global health infrastructure, cross-disciplinary modeling, or the governance foundations required for coordinated species-scale work-logic cascades will find this paper’s methods and findings relevant.
Readers who can’t stand fear-mongering, abhor needlessly drastic quarantines, and wish to fight pandemics with gentle kind reasonable fun may find here a basic mechanism for motivating Virodefense Olympics, to be organized globally each year by growing wide interdisciplinary diversity-encouraging Flying University Networks. By investing in such open wid-e FUN actions, humanity can grow the general citizen science skills required to beat the next pandemic before it starts.
Abstract
The COVID-19 pandemic demonstrated that humanity’s ability to respond to novel respiratory viruses remains dangerously inadequate.
This study extends the classical Susceptible-Infected-Removed (SIR) model to include a Germ Gap — that spatially and temporally separates individual infectious particles (“Germs”) from Infected individuals and Susceptible hosts. The resulting SGIR framework enables more principled predictions of extinctions of Germ populations in the Germ Gap.
To test this SGIR framework it was implemented in “PandemicSociety101”, a stochastic pure mass-action model with seven infection stages, a simplified testing laboratory, hospital capacity monitoring, and multiple pathways to death or recovery. It was written for the Prototype Evolvix Compiler to facilitate seamless switching between ordinary differential equation systems (ODE, faster for huge populations) and the Stochastic Simulation Algorithm (SSA, more accurate by respecting the indivisibility of individuals).
Using parameters calibrated in Spring 2020 to the US COVID-19 pandemic (330 million population, 16 infections on 2020-02-14), this study simulates an uncontrolled pandemic that infects approximately 289 million people and kills approximately 13 million in Scenario 1 (without behavioral changes).
Scenario 2 starts with 1.5 million infections on 2020-05-17 but can also assume a 50% reduction in probabilities for Actions that both Shed and Catch the virus. Such a modest reduction is achievable through coordinated use of face masks, hygiene, and distancing. Simulations show that despite the late start such organizing can stop this pandemic at approximately 4.8 million total infections and 310,000 deaths. This represents a 60-fold reduction in infections and a 42-fold reduction in deaths compared to uncontrolled spread. This study also identifies a dangerous cognitive trap here called linear fooling. In it limited testing capacity creates an illusion of pandemic control precisely when infections are growing fastest.
These results suggest that non-pharmaceutical interventions that increase the Germ Gap can be remarkably effective without vaccines or herd immunity, provided they are deployed with sufficient coordination across populations. The mechanistically simple Germ Gap model – if well-explained – might play a key role in helping to persuade communities to voluntarily improve pandemic resistance by measuring key parameters of the Germ Gap in citizen science projects that cover the most relevant cases of use in gentle kind reasonable ways.
To help continue improving pandemic resistance over the long term may critically depend on open, well-organized, annual, global Virodefense Olympics. Such games may encourage the wide interdisciplinary diversity-encouraging (“wid-e”) research, which is essential for finding gentle kind reasonable solutions that increase the Germ Gap in the myriads of real-life scenarios that matter most.
1. Introduction#
The COVID-19 pandemic killed millions of people worldwide and exposed fundamental weaknesses in how societies understand, monitor, and respond to infectious disease outbreaks. While vaccines eventually became available, the period before their deployment saw enormous variation in outcomes across countries and regions, with non-pharmaceutical interventions (NPIs) such as face masks, physical distancing, and hygiene practices playing a critical but contested role [Talic et al., 2021]. Major modeling efforts during the pandemic — including the Imperial College projections that drove UK lockdown policy [Ferguson et al., 2020], the SIDARTHE model for Italy [Giordano et al., 2020], and projections of post-pandemic transmission dynamics [Kissler et al., 2020] — demonstrated both the power and the limitations of mathematical modeling for guiding pandemic response.
The classical Susceptible-Infected-Removed (SIR) model ([Kermack and McKendrick, 1927]) and its many extensions have been the workhorses of mathematical epidemiology for nearly a century. These models typically represent transmission as a direct interaction between Susceptible and Infected individuals, parameterized by a transmission rate that implicitly bundles together all the physical, biological, and behavioral factors that determine whether infection occurs.
This implicit bundling, while mathematically convenient, obscures the mechanistic chain through which respiratory viruses and all germs actually spread: individual germs like virus particles are shed by an Infected person into the environment, those viable particles must not decay for long enough to allow a Susceptible person to catch them from that gap. These three steps — Shed, Decay, and Catch — always play together and can be independently influenced by human behavior and technology. Face masks reduce both Shed and Catch rates. Ventilation and UV sterilization increase Decay rates. Physical distancing thereby becomes a randomly kind act of advancing local social cohesion and global care by reducing the probability that a shed virus particle reaches a susceptible person before decaying. In that abstract population sense it is mathematically indistinguishable from vaccination, as both work by reducing the probability that random particles infect Susceptible individuals.
This study proposes the SGIR model (Susceptible - Germ Gap - Infected - Removed) as a conceptual framework extension that makes this mechanistic chain explicit by tracking the Germ Gap — the effective separation between Infectious individuals and Susceptible individuals. The Germ Gap is not merely a spatial distance; it is a composite measure that incorporates the physical, temporal, and behavioral barriers that virus particles must traverse to cause new infections. Increasing the Germ Gap is the fundamental goal of all non-pharmaceutical pandemic defense. Typical SIR models cannot help here, because they pretend mathematically that there is no independent Gap; they are indistinguishable from models that assume that infection can happen only in direct random meetings between Infectious and Susceptible individuals, and that infection always happens at such meetings with a given probability.
The reframing in SGIR models has practical consequences:
It redirects attention to measuring the Germ Gap experimentally.
It focuses efforts on increasing the Germ Gap by equipping populations with the expertise and tools to do so.
It illuminates causal mechanisms that connect practical social-justice concerns to epidemiological outcomes: crowding, poverty, and inadequate housing all shrink the Germ Gap, mechanistically explaining why disadvantaged populations bear disproportionate pandemic burdens ([Caplan et al., 2020], [Mosley et al., 2025]).
The same mechanism works in reverse. Investments in living space, ventilation, and workplace safety increase the Germ Gap and so reduce transmission across the whole population, not only the worst-off. In such cases disease protection emerges as a structural side effect of certain forms of equitable development — which makes such investments in humane equal dignity considerably more self-serving than they may seem at first glance. Such investments may shrink the short-term bottom lines of a few moneyed special interest groups; however, over the long term pandemic-grade investments in social cohesion are priceless, because they build a kind of stability that cannot be bought “on demand” once a pandemic is already slow-motion exploding.
When the Germ Gap gets compromised, the pandemic burden often hits those harder who do much essential work for upholding a society. For example, the demographic composition of the U.S. health workforce [National Center for Health Workforce Analysis and Health Resources and Services Administration, 2014], read alongside [Gould and Wilson, 2020] and [Wurth et al., 2020], shows how systemic racism and economic inequality act as preexisting conditions that mechanistically shrink the Germ Gap for African Americans and many other marginalized communities. Yet, where such minorities are essential for health care, systemic inequalities that hit them hard can spiral into much broader problems. Face masks are easy to produce over the short term, better housing can be built over the mid term, but raising, training, supporting, and retaining a generation of good nurses is a much more long-term undertaking that requires corresponding long-term planning. How useful are visions of “a thousand Einsteins and a thousand Mozarts” born in future off-world colonies [Bezos, 2019], if most of present would-be Einsteins on Earth lack the basics they need to develop their gift? More pointedly, if economic pressure forecloses vocations of sustained research, then how is that different from forcing the Einsteins of this world to accept indirectly forced labor if they wish to avoid starvation? The pattern is global and plays out by default unless enough leaders and institutions can be persuaded to walk the narrow path towards developing the mental wealth of all the people in all the nations [Beddington et al., 2008]. If the major conclusions presented here are correct, then winning against pandemics is impossible without such a broad development of mental wealth for all.
This is not a quick fix. There is no broad and easy path to the gentle kind reasonable solutions that less powerful countries need to support their not-yet Einsteins and Mozarts (e.g. see [Wintour, 2020]). The network effects are complicated. Even extremely powerful people cannot forever escape the network effects of their actions on the less fortunate; for example, [Wilde, 2018] reports how Stalin’s purge of his own physicians left him without competent care when his fatal stroke came — short-term cruelty toward a constructed “out-group” boomeranging on an unwitting perpetrator. The pattern is not new: [John of Ephesus and Pearse, 543CE, 2017] reports how during the Justinianic plague (542 C.E.) the poor died first and how some saw this as the better fate because of the horrors that followed. It is striking to see the SGIR Germ Gap mechanism reverberate across centuries. Yet, note how a narrow path to beating complicated network effects does not imply that it cannot be found. If it can be found and defined, then it can be explained and taught. Hence, the importance of mental wealth for life-giving decision-making.
Why does the same dynamic keep repeating? [Hare, 2017] and [Hare and Woods, 2020] propose that humans succeeded as a species through selection for prosociality — the human talent that enables coordinated cooperation by trusting others. Stopping a pandemic in mid-flight may therefore depend on something much deeper than face masks, vaccines, and short-term administrative decisions.
This study is built on the working premise that stopping pandemics requires mental wealth and the will to construct reliable work-logic cascades for trusting others in order to extend genuine cooperation. This trust-based cooperation is essential for gentle kind reasonably increasing pivotal Germ Gaps through life-giving decision-making for the common good of everyone. Further analyses in other papers of the Matheo series (see Balospe.com) show that such work ultimately forces a stark value decision, because maximizing infinitely divisible dividends structurally conflicts with best supporting the intrinsic value of indivisible individuals. One of these ultimate priorities must take the lead in how countless conflicts of interests are resolved in a complex world. This study presumes that humane equal dignity is best guarded by respecting the intrinsic value of unique and indivisible individuals and that this value is worth guarding even if at the cost of compromising the maximizing of bottom lines of infinitely divisible dividends.
These abstractions matter, because pandemics cannot exist without infecting indivisible individuals and to do so individual germs must cross infinitely divisible Germ Gaps between individuals. Increasing Germ Gaps can stop pandemics as shown below, but doing so cannot succeed at scale without investing divisible resources accordingly. How to best increase Germ Gaps without overdoing it requires myriad more detailed models of the SGIR type. To best guard individuals from infections without overdoing it, the studies that build such models must invest their resources accordingly. This study does not aim to construct any specifically applicable SGIR model with all the operational details needed for deployment in any particular demographic. The aim here is more basic.
The goal of this study is to introduce the conceptual framework required for building SGIR models and to test its usefulness with a very simple question.
Does there exist any biologically reasonable scenario in which the SGIR framework points to realistic changes in Shed, Decay, or Catch rates capable of stopping a COVID-19-sized pandemic without a vaccine?
To this end the SGIR framework is implemented in a model here called “PandemicSociety101”. This model tracks counts of individuals through seven stages of infection and includes a simplified testing laboratory and hospital system. Its code is formulated for the high-precision computational workers of the Prototype Evolvix modeling language [Loewe and EvoSysBio Group at UW-Madison, 2015–2026], which supports both deterministic (ODE) and stochastic (SSA) simulation modes to facilitate forecasting time courses of how many individuals of the modeled types exist. Analyzing the deep stack of mathematical models thereby constructed amounts to a constructive existence proof that indeed there exist at least some biologically reasonable scenarios in which a pandemic can be stopped in mid-flight without vaccines, simply by using imperfect face masks at sufficiently large scales.
This report is organized as follows. The next section (2) describes the basic SGIR concept, its underpinning pure mass-action implementation, and the concrete PandemicSociety101 model built on these, before detailing scenarios and parameters derived in Spring 2020 from observing the unfolding Coronavirus pandemic. The Results (3) describe how an uncontrolled pandemic can unfold in this model and how a simple calculation can be used as an effective early warning system. Then simple non-pharmaceutical interventions (NPIs) are described that can avert the brunt of a pandemic even after it started, albeit only if a certain population-wide mobilization can be achieved. Since such a mobilization critically depends on clearly communicating critical information on the state of the pandemic, various non-trivial cognitive traps are discussed that emerge for all who try to observe an unfolding pandemic from inside of that pandemic. The final Discussion (4) summarizes advantages and limitations of SGIR models as actionable frameworks and points to the pivotal importance of a sufficiently well-organized coordination infrastructure for non-pharmaceutical virodefense. The possibility of organizing annual global “Virodefense Olympics” to keep improving pandemic defenses is raised before concluding that working through the implications of the SGIR model offers meaningful contributions to both, the post-processing of what happened during the Coronavirus pandemic, as well as the preparation for helping to reduce the risks for the next pandemic.
2. Model Description#
2.1 The SGIR Framework for modeling Germ Gaps#
The classical SIR model tracks three types of individuals: Susceptible (S), Infected (I), and Removed (R). Transmission occurs when S and I individuals interact, at a rate proportional to the product S * I. That rate is defined as the much discussed quantity R0, which offers the following simple intuition: If R0 > 1 an epidemic will be growing (presumably to infect the whole population unless herd-immunity gets in the way); otherwise it will die out locally. This simplicity is in contrast to the exceeding difficulties in dissecting mechanistically what R0 might be in any specific context (beyond deriving it operationally like a black box parameter estimated from observed doubling times).
The SGIR model introduces two new conceptual types of individuality that combine to form the Germ Gap — Germ (the individual infectious particles inside) and Gap (the finite physical environment that holds them) — with G in SGIR standing for that Germ Gap. Thereby SGIR models offer a mechanistic way to help to disentangle the mathematical conglomerate parameter R0, which describes all necessary and sufficient steps of transmission with a single number. The Germ Gap represents the physical environment through which virus particles (“Germs”) must travel between an infected source individual and a susceptible target individual. (In this paper Germ Gap names the technical concept; figures may retain the equivalent label Gap of Germs; see Section 4.1 for the naming rationale.) The transmission chain then becomes:
Infected — (Shed) —>Gap — (survive Decay) —>Germs — Catch —> Susceptible turns Infected
Each step has its own rate to help track the amount of individual germs:
Shed rate: How many Germ particles an infected individual releases per unit time. This depends on infection stage (asymptomatic individuals may shed less or more than symptomatic ones), respiratory activity (e.g. singing sheds more than breathing), and protective measures (e.g. masks reduce shedding).
Decay rate: How quickly Germ particles become non-infectious in the environment. This depends on environmental conditions (e.g. temperature, humidity, UV exposure), surface properties, and active decontamination measures.
Catch rate: The probability that a susceptible individual encounters and is infected by surviving Germ particles. This depends on factors like proximity, ventilation, protective equipment (e.g. masks), and individual immune factors.
In a first approximation, the Germ Gap can be seen as effectively the inverse of the product of these three rates: when any rate decreases, the Germ Gap increases and transmission slows. The key insight is that small reductions in each of the three rates compound multiplicatively, potentially achieving large overall reductions in transmission without requiring any single intervention to be perfectly effective. Thus, it is possible in principle to push a potential pandemic that has a R0 > 1 for one given set of behaviors in a population to become R0 < 1 once a suitable different set of behaviors is adopted. As the simulation results presented below show, this transformation can apparently even be achieved after a pandemic is well underway, as long as it has not yet run its course.
2.2 PandemicSociety101: Implementation#
Figure 1 provides an overview of the complete PandemicSociety101 model architecture, showing all compartments, transitions, rate parameters, and the connections between infection stages, the testing laboratory, hospital system, and recovery/death pathways. The model’s input scenarios (Scenario 1: Feb 2020, Scenario 2: May 2020) and their parameter configurations are also indicated.
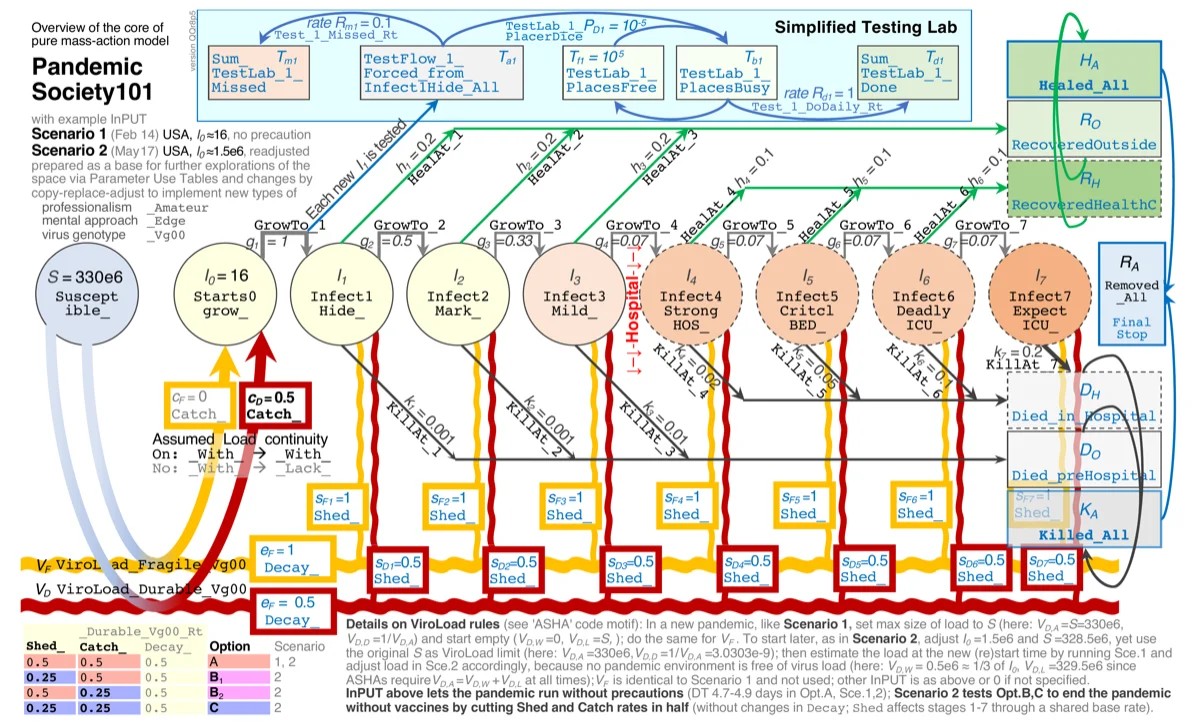
Fig.1: Core model of PandemicSociety101 (full size | list | download).#
PandemicSociety101 implements the SGIR concept as a pure mass-action stochastic model using the Prototype Evolvix Compiler modeling language, variant MMs0r3p1 [Loewe and EvoSysBio Group at UW-Madison, 2015–2026]. The model uses the Sorting Direct Method for stochastic simulation ([McCollum et al., 2006] as implemented by [Ehlert and Loewe, 2014]) and the Sundials IDAS solver for corresponding deterministic ODE integration ([Hindmarsh et al., 2005]). All rates are specified in units of 1/day.
Infection stages. The model tracks individuals through seven infection stages following initial virus contact:
Stage |
Duration |
Description |
|---|---|---|
Starts0grow |
1 day |
Virus growth initiated; not yet infectious |
Infect1Hide |
2 days |
Infectious, high shed, no symptoms, hidden status |
Infect2Anti |
3 days |
Infectious, high shed, hidden, antibody-positive |
Infect3Mild |
2 weeks |
Infectious, symptomatic; most individuals recover here |
Infect4StrongHOS |
2 weeks |
Strong symptoms, requires hospital bed |
Infect5CritclBED |
2 weeks |
Critical symptoms, needs hospital bed or dies |
Infect6DeadlyICU |
2 weeks |
Needs ICU or dies |
Infect7ExpectICU |
2 weeks |
Expected death; beyond ICU capacity to save |
Individuals progress through these stages and exit the pandemic as either Recovered (outside or in hospital) or Dead (pre-hospital or in hospital). Recovered individuals are assumed immune and cannot be reinfected within the simulation timeframe. To simplify the model, overall population size changes during the time of the pandemic are assumed to be negligible (i.e. no births and no independent deaths of individuals).
Virus tracking via ASHA. The environmental virus load (the “Gap”) is tracked using the ASHA (Aggregated State Homogeneity Approximator) framework used here for the first time. It maintains density-dependent dynamics by tracking the number of environmental “places” that are either contaminated (“With”) or clean (“Lack”) out of a fixed total (“Aces”). This provides proper density-dependent saturation — the environment has a finite capacity for virus, preventing exponential accumulation, which cannot happen in reality. The idea for ASHA grew from the need to be able to tune more parameters of population models than usually exposed in oversimplified models. Examples demonstrate the profound loss of understanding that can result from oversimplified models that pack too much biology into a composite parameter (such as carrying capacity K, [Mallet, 2012]).
The ASHA framework is built on respective concepts (see [Mallet, 2012]), as illustrated and extended in Figure 2 and 3.
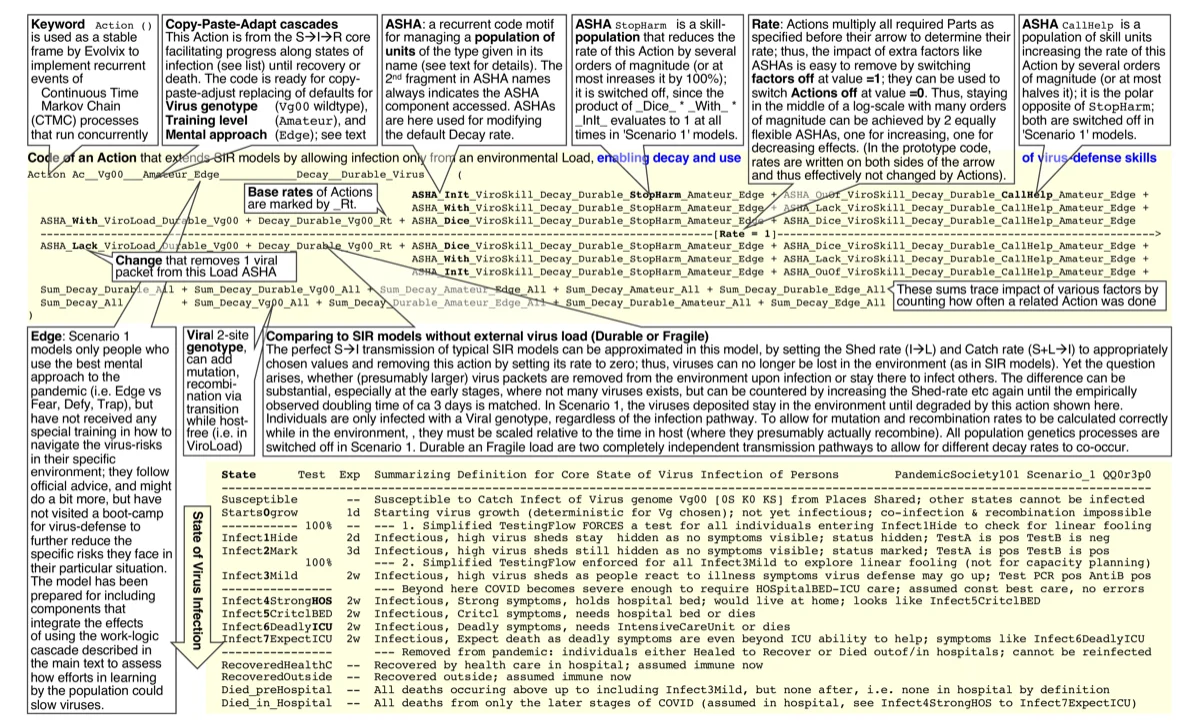
Figure 2 shows how Evolvix Actions define the elementary events that move time forward in the model. If the required individual Parts exist, the assumption of random mixing dictates that they will eventually meet randomly. When they do, the respective Action may happen with a certain defined rate per time. If the Action happens, all required Parts instantly disappear to produce new Parts, the products of that Action. The specified Rates for an Action are all multiplied together to define its propensity to happen next. In a stochastic system, where the individuality of Parts cannot be divided up, a Stochastic Simulation Algorithm (like the Sorting Direct Method [Ehlert and Loewe, 2014, McCollum et al., 2006]) calculates the propensities of all actions and then rolls the dice to find the next Action and when it will occur. Then time is moved forward, the changes defined by that Action are then implemented by changing the respective Amounts of all Parts involved in that Action. Finally propensities are recomputed for the next Action. This flexibility in the timing of Actions allows for the indivisibility of individual Parts to be preserved. This contrasts with deterministic simulations, where the time-steps forward are assumed to be primary and the Amounts of Parts are instead treated as infinitely divisible. This can lead to fundamentally different biological outcomes, because populations with only half an individual left are extinct in reality. See [Ehlert and Loewe, 2014] and the one-page overview in [Loewe and EvoSysBio Group at UW-Madison, 2015–2026] for an introduction to how these approaches contrast.
This formalism is equivalent to the standard mass-action kinetics formalism, albeit implemented with extra care to ensure that the individuality of individual Parts is always respected when simulated stochastically. Moreover, a declarative syntax is used that was designed to make elementary biological Actions easier to check in bottom-up modeling (in contrast to differential equations, which assume a system-wide overview).
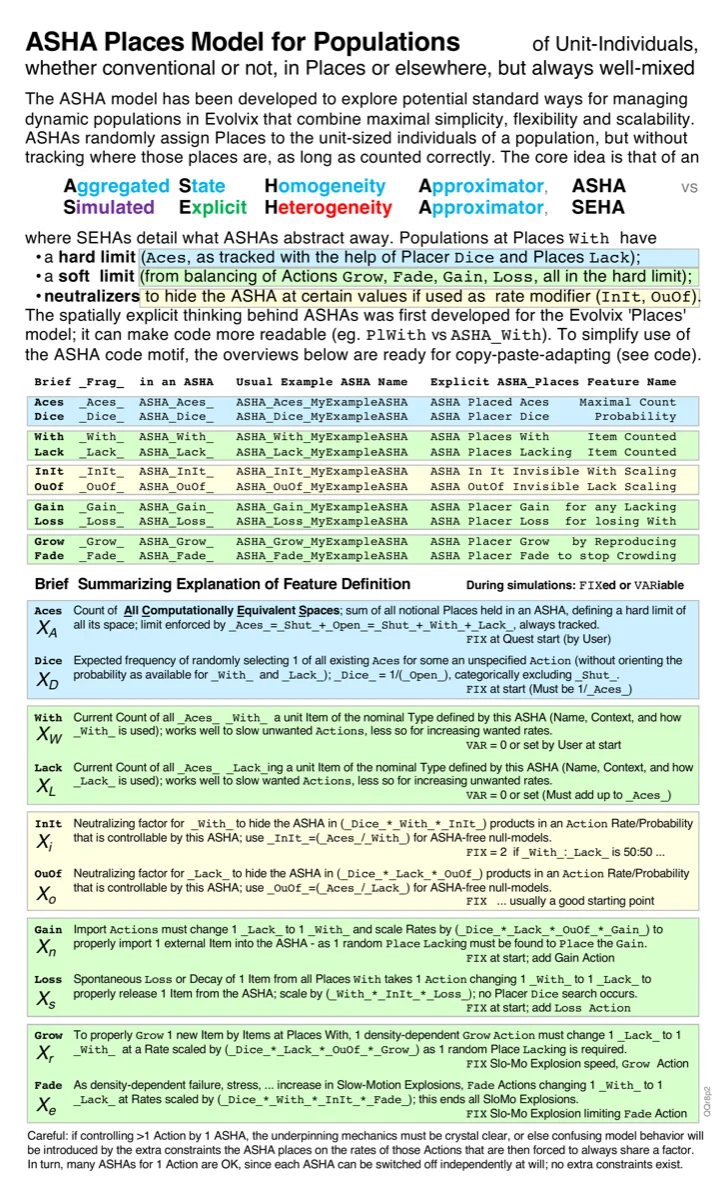
Figure 3 shows how ASHAs extend this rigorous mass-action kinetics by assigning unit-sized Places to unit-sized individuals in a population, tracking how many Places (”Aces”) are With or are Lacking a given individual (e.g., a virus contamination), out of a fixed total number of Aces. This provides ten variables to define an ASHA (Aces, Dice, With, Lack, InIt, OuOf, Gain, Loss, Grow, Fade) that control density-dependent dynamics by defining explicit biological functions. Such an explicit approach to biouncertainty is preferred here to the implicit bundling of uncertainty into summary parameters (like carrying capacity K, see [Mallet, 2012]), because the resulting clarity may open up new avenues for measuring important quantities or at least help clarify critical biological distinctions. The full ASHA specification is in the Supplementary Prototype Evolvix model code; Figures 2 and 3 provide a visual guide for reading that code.
Actions in this model (as shown in Fig.2) also formally interact with two special abstract ASHAs called “StopHarm” and “CallHelp”. These parts of the code exist to help model the effects of scaling up population-wide work-logic cascades in case such cascades are constructed while the pandemic is still active. The Discussion points to a related study from 2020 that argues why it is feasible to scale up such work-logic cascades to help coordinate pandemic defenses. For the purposes of this study here all these work-logic cascades in the code are effectively deactivated by setting all respective parameters to 1, which means that they do not bias any Actions in this model in any way. The purpose of this study here was to determine, whether it is possible in principle - given a 100% adoption rate of an imperfect measure - to substantially slow a pandemic after it has long left its stochastic stage. If this cannot be demonstrated in principle for at least one biologically realistic parameter combination, then one might argue that there is little point in trying. In that case, without vaccines, the much debated herd-immunity does indeed become the only remaining dim hope for slowing a pandemic. However, as shown below, parameter combinations exist that inspire the hope that it is indeed possible to stop an unfolding pandemic in mid-flight.
Here virus particles are classified as either Fragile (decaying quickly, e.g., airborne droplets) or Durable (persisting longer, e.g., surface contamination), each is tracked by its own ASHA instance. Each infected individual in each infection stage contributes to viral shedding at stage-specific rates.
Simplified testing laboratory. The model includes a simplified testing pathway where 100% of individuals are tested at entry into Infect1Hide and Infect3Mild stages. This design is deliberately simplified to explore the phenomenon of linear fooling (see Results) rather than to model realistic testing capacity.
Hospital system. Individuals reaching Infect4StrongHOS and beyond are all assumed to receive hospital care. The model tracks hospital and ICU occupancy and distinguishes between deaths occurring before hospital admission and deaths in hospital.
2.3 Scenarios and Parameters#
Scenario 1 (Uncontrolled, 2020-02-14): 16 infected individuals in a population of 330 million (US). No behavioral change, no interventions. Virus transmission parameters reflect baseline SARS-CoV-2 characteristics. This scenario calibrates to the observed US doubling time of approximately 3.25 days in the early phase in 2020. The resulting parameters lead to approximately 4.8 days doubling time as measured from the simulated model output.
Scenario 2 (Face-masking, 2020-05-17): Starting from 1.5 million infections in a population of 330 million, with three sub-options:
Option A: No change in Shed, Decay, or Catch rates (baseline). Then the pandemic continues as in Scenario 1.
Option B: 50% reduction in either the probability of virus Shed or Catch rate. This represents partial facemasking (or equivalent NPI adoption).
Option C: 50% reduction in both Shed probability and Catch probability simultaneously. This represents fully coordinated facemask adoption at the defined level of efficiency (or equivalent NPI adoption by other means).
The full model specification, including all parameter values and ASHA configurations, is available as Supplementary Material (Evolvix source code, ~3,900 lines). To generate the raw results for the figures shown, the corresponding parameter combinations in that file need to be switched on or off, respectively.
3. Results#
3.1 Scenario 1: Anatomy of an Uncontrolled Pandemic#
Without interventions, the PandemicSociety101 model simulates a pandemic that infects approximately 289 million people of the 330 million US population modeled. Of these 13.8 million individuals die.
Three stochastic simulation replicates closely track the deterministic prediction made by ordinary differential equations (Fig.4). This confirmes that for a population of 330 million, stochastic effects are minimal when starting with 16 individuals. The only time when such stochastic effects are even observable is during the earliest phase when infection counts are small enough for chance effects to slightly delay or accelerate further spreading.
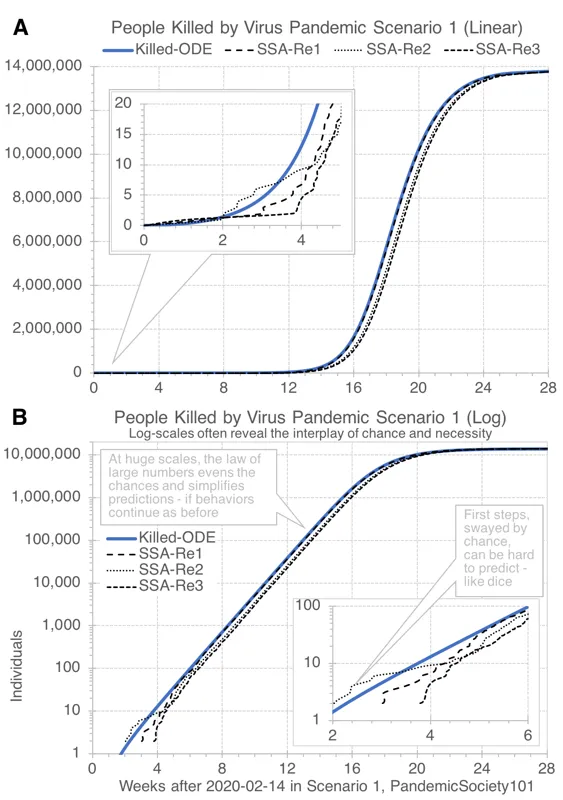
Fig.4: Pandemic deaths in default Scenario 1 on linear and on log scales (full size | list | download).#
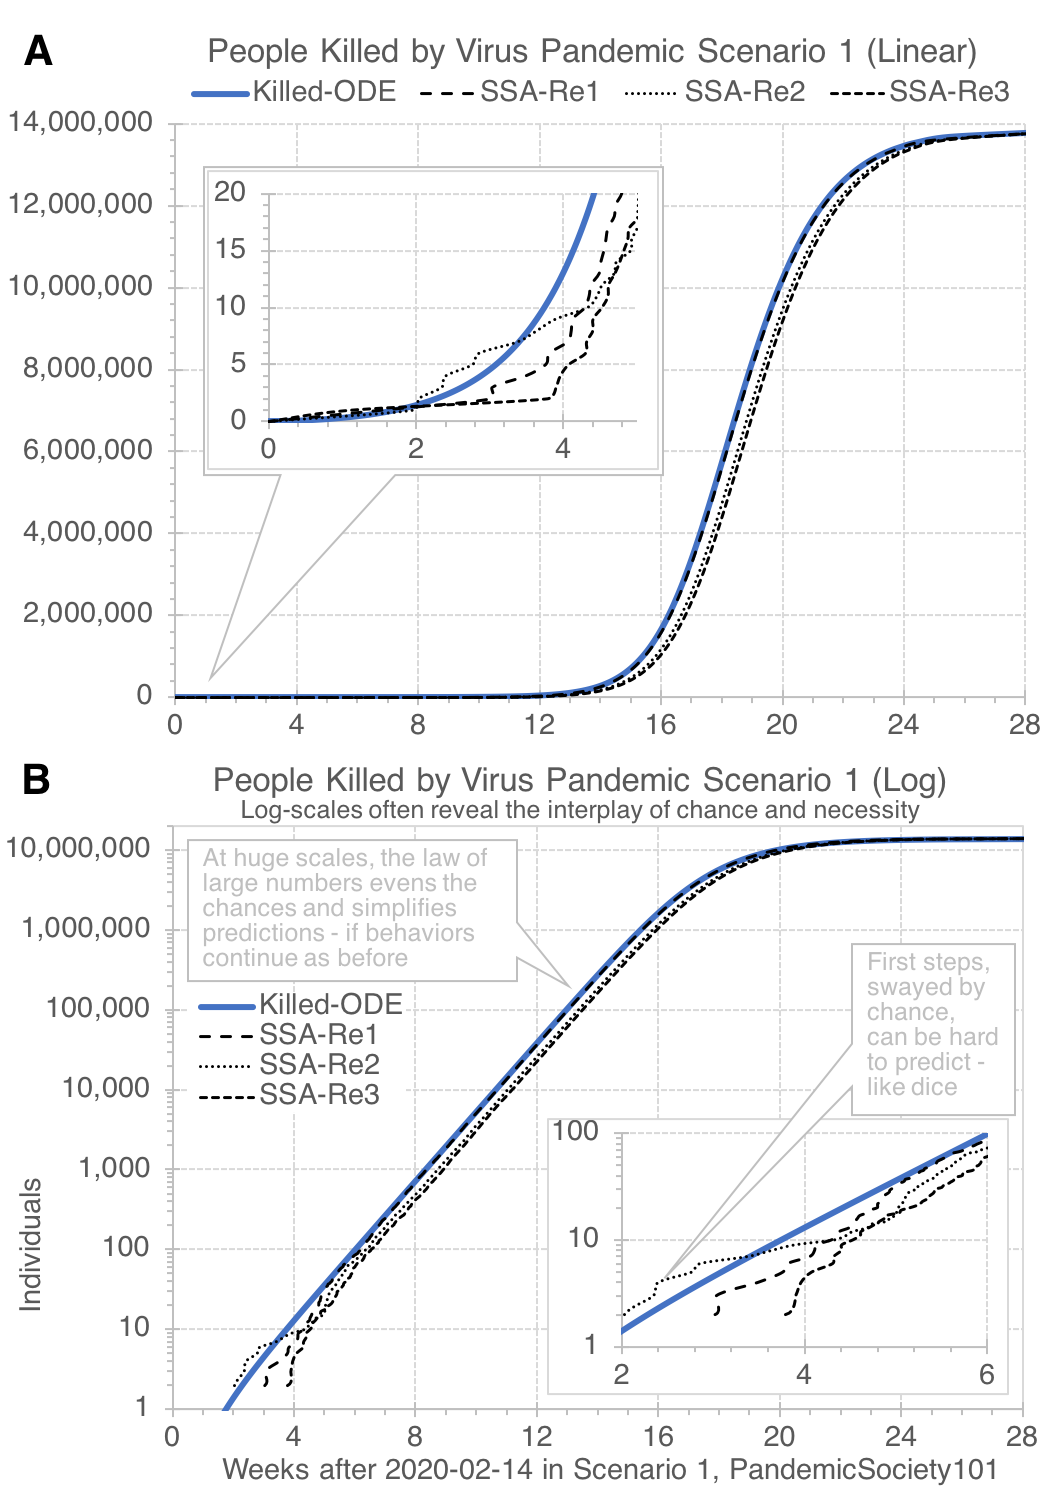
Fig.4A shows the pandemic growth on a linear scale, which is only helpful during the later stages of a pandemic. Since pandemics are mostly driven by multiplicative growth, Fig.4B shows the same simulation results on a log scale, which is more informative during the early stages of multiplicative growth.
Communicating clear and present danger from slow-motion explosions. Much thought was given to how the tricky multiplicative dynamics of pandemics might be translated into clearer language for people who are not used to dealing with the underpinning mathematics. A simple analysis of general audience pragmatics and semiotics of the respective mathematical language revealed a major barrier to all who wish to use its standard terminology to communicate the urgency of pandemic actions. The keywords to translate here are “exponential growth”. Both words seem to make sense to most people. Unfortunately they map intuitively to the wrong notions in the unreflected use of most people. “Growth” is a good thing most of the time in the mind of most people, and “exponential” means “a lot”. Thus, “exponential growth” maps intuitively to “a lot of a good thing” for most people, unless they think through the context, which tells them that fast growth of a dangerous virus is not a good thing. To find a way around this problem, the term “slow-motion explosion” was defined for describing the growth of a pandemic. It maps to the same underpinning chain-reaction that drives any explosive growth from nuclear chain reactions to pandemic transmission growth. All these are mathematically describable by exponential functions. Including “slow-motion” highlights the fact that pandemic times of response to changes in behavior are closer to response times of steering a container-ship than a race car. Ending with “explosion” highlights the fact that the impact of the respective shockwave will come nevertheless and is in principle contained by the space in which it happens. That this space is usually best described in multiplicative terms is only one of several unusual aspect of how pandemics work.
To underscore the multiplicative nature of pandemic slow-motion explosions, it is generally useful to show how they unfold on a log-scale. Hence, many figures here are shown on a log-scale. The linear scale tends to be most useful for the last few moments before a slow-motion explosion crashes into its hard limiting space factor (it is impossible to infect more individuals than exist in a given population).
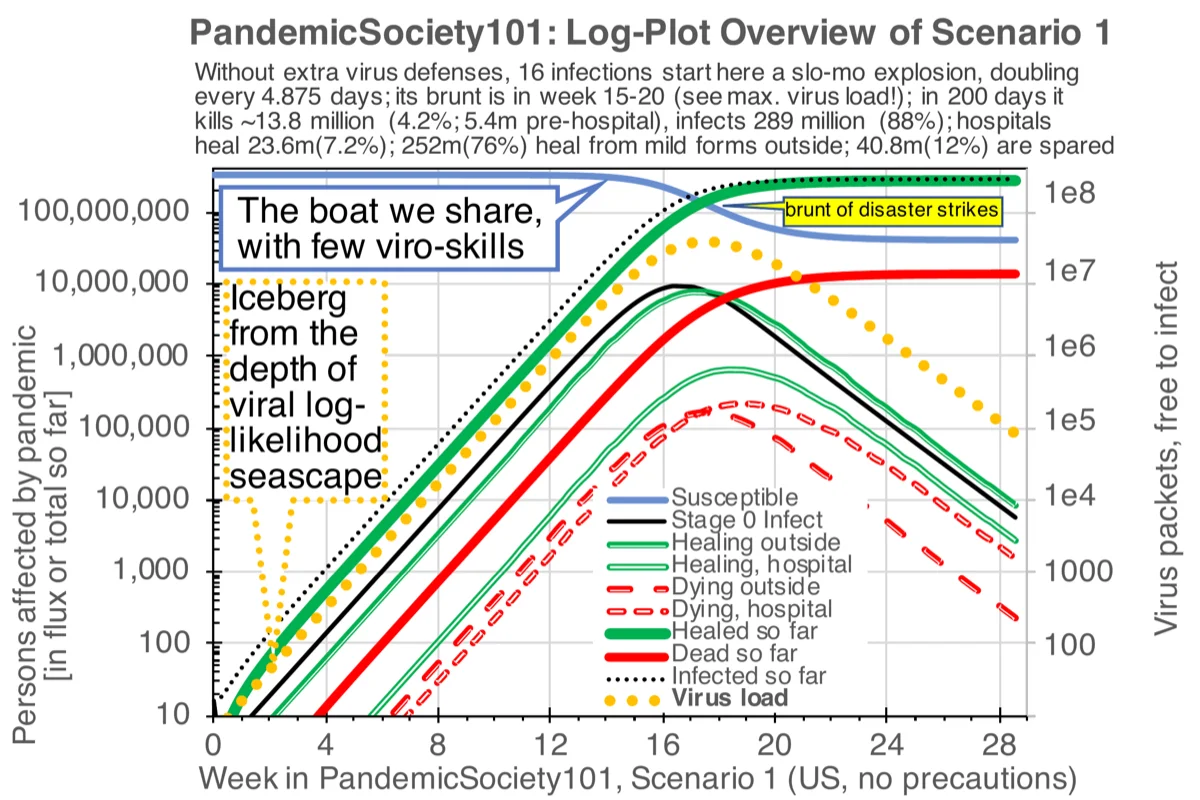
Fig.5: Log-plot overview of uncontrolled Pandemic Scenario 1 (full size | list | download).#
Fig.5 shows an overview of several interesting quantities for tracking slow-motion explosions on a log-scale in the PandemicSociety101 model without interventions. In this model the pandemic infects approximately 289 million people (88% of the 330 million population) and kills approximately 13.8 million (4.2% overall; 5.4 million pre-hospital, with 23.6 million (7.2%) healing in hospitals and 252 million (76%) recovering from mild forms outside hospitals). Approximately 40.8 million (12%) are spared infection entirely.
In Fig.5 one may think of the virus load as an unexpected “iceberg” emerging from the deep, which drives infection rates upward while remaining invisible on linear scales for most of the time - and hence on collision course with the ship of the civilization it attacks.
A careful comparison to Fig.4 shows that in week 1 to week 14 on a linear scale, the virus seems to do “almost nothing” during the period when in reality it is most active in establishing the ultimate size of the slow-motion explosion it causes. By the time infections become visible on a linear plot, the “exponential growth” phase is nearly complete and the size and punch of the slow-motion explosion have been almost completely determined.
This linear-vs-logarithmic perception gap is a fundamental barrier to broader public understanding of pandemic dynamics. While it is easy to explain in principle, there is such a long list of detailed implications and complications that even experts get easily tripped up (as other Results in this study show).
3.2 The HalfMax method as an early warning system for pandemics#
How even experienced modelers can be fooled. Figure 6 illustrates a sobering point about the deceptive nature of exponential growth on linear scales. This figure, from Loewe’s earlier work on stochastic simulation algorithms (Fig.7a in Ehlert and Loewe, 2014 [Ehlert and Loewe, 2014]), shows 100 stochastic simulations of a simple unbounded exponential growth model starting from 10 individuals.
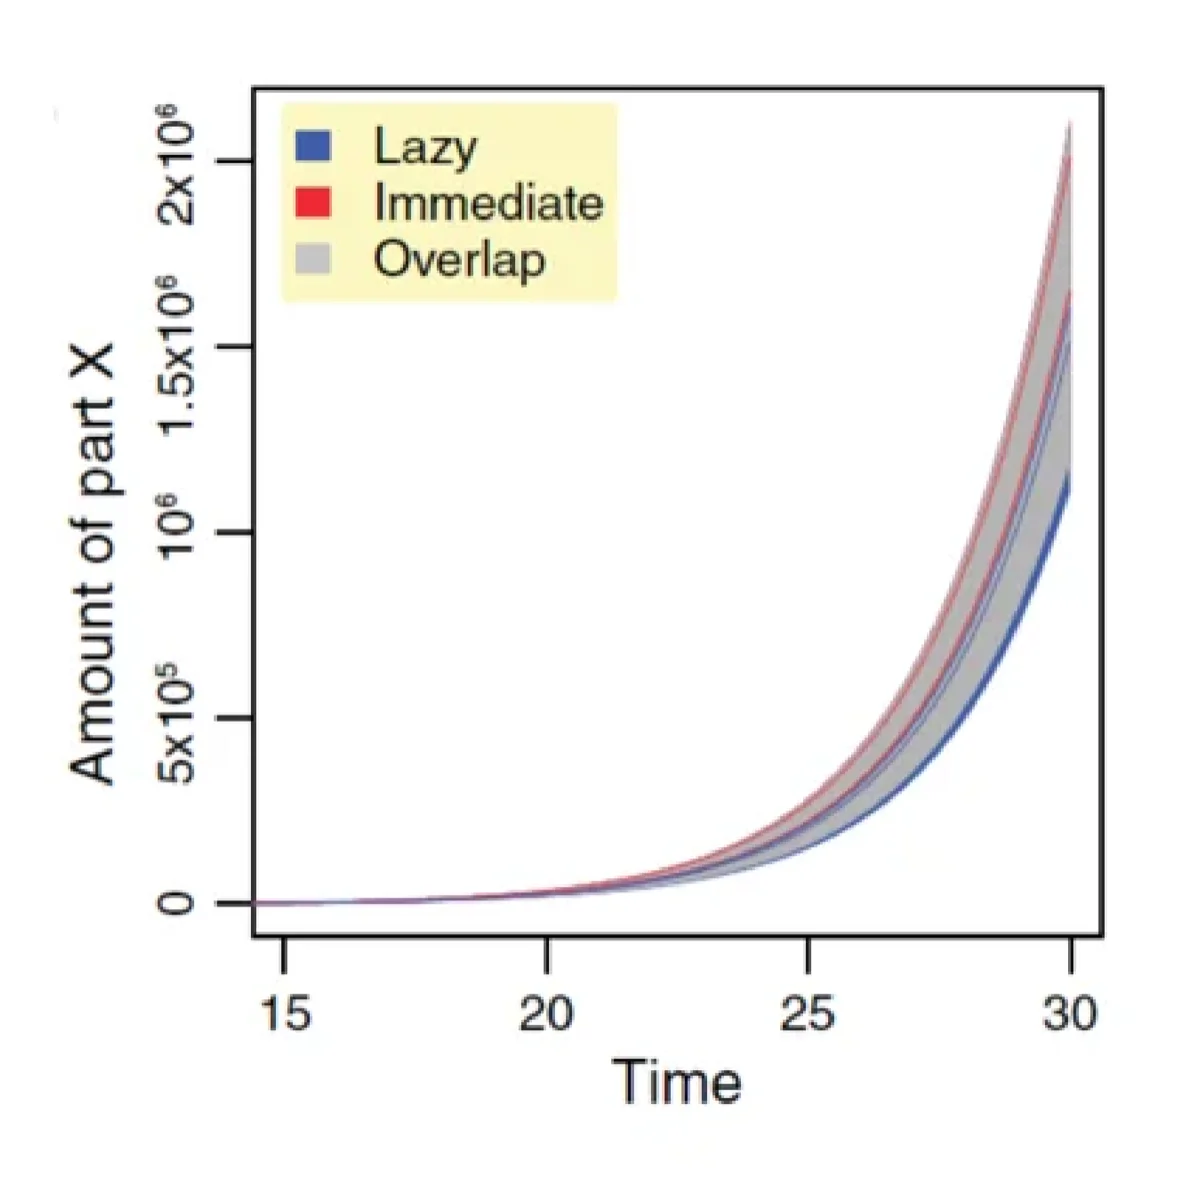
Fig.6: Slow-motion explosions are easy to miss (full size | list | download).#
On a linear scale the resulting slow-motion explosion shows the characteristic “hockey stick” pattern: the population appears invisible for a long time, then suddenly explodes. These simulations were produced in 2014, years before COVID-19. Loewe had extensive experience interpreting systems that are much better understood on multiplicative log-scales. Yet when he read US reports of 16 Coronavirus infections on 2020-02-15 — a number strikingly close to the 10 individuals that reliably triggered well-defined exponential growth in his 2014 simulations shown in Fig.6 — even he failed to realize the significance of that alarming information. If a linear scale can make a deterministic slow-motion explosion look like “nothing is happening” to even fool a researcher whose professional work centered on exactly these dynamics, what chances do others have who live much more in the linear world. This personal experience underscores the systemic nature of linear fooling: it is not a failure of knowledge but a failure of perception that affects everyone, including even some experts who should theoretically and practically know better.
HalfMax method. It is pivotal to mitigate this perception problem in order to increase the reaction time remaining for behavior modification before the brunt of a pandemic hits. Like other early warning systems for natural disasters, such as tsunamis and tornados, there is no exact way to predict the precise amount of damage that will result from doing nothing. Except it is clear that maximal damage will result from not seeking shelter, which is equivalent to no behavioral modification when a pandemic hits. Yet, even though pandemics move slower than tsunamis or tornados, time is of the essence. To communicate that urgency it is essential to have a reliable early-warning system for calculating how much time might still remain if the current behavior and the current germs were to continue without notable changes.
To this end this study proposes the HalfMax-method, a quick rule-of-thumb method that only needs a pocket calculator for helping a broader audience without access to sophisticated simulation models to quickly translate a reported doubling time T Doubling into an expected waiting time before the brunt of a pandemic will hit — if nothing changes, i.e. all rates stay as they are and a random mixing population without changes in behavior can be assumed. The HalfMax method is not about precision; it’s about triaging whether an emergency response is needed and how much time may remain to organize it.
The HalfMax-method builds on the basic understanding that all pandemics are slow-motion explosions that follow the logistic growth curve, which predicts that absolute growth will be fastest at half of the maximal capacity, before it starts to slow down again.
This allows for a simple doubling-time arithmetic to estimate the HalfMax point when 50% of the population will be infected and hence infection rates will be highest before they naturally slow down as susceptible individuals get increasingly rare.
The point in having such a simple “pandemic count-down” timer at hand is in distributing as best possible the work required to increase Gaps of Germs such that the overall size of the pandemic can be reduced before it is too late. Interventions after the HalfMax point will have significantly less impact and their effectiveness may be difficult to distinguish from an expected natural decline in infection numbers.
If everyone can calculate the worst based on observed data, everyone can help to reduce impact. It only takes a pocket calculator to compute a HalfMax waiting-time forecast for T HalfMax. Therefore the HalfMax-method is easily implementable and checkable where it matters most: at places of decision, where behavioral recommendations are made that affect the Germ Gap. If a rational explanation is given and people can check it, a given mitigation strategy that requires some sacrifices in comfort is much more likely to succeed.
Hence, the value is not in a precise point estimate; a min-max range should always be given. The greatest value of the HalfMax method is in helping to reduce the ‘blind faith’ that many felt was required of them in the Coronavirus pandemic.
The HalfMax core equation is:
T HalfMax ≈ T Doubling × log 2 ( N HalfMax / N NowInfected ) (Eq.1),
where N HalfMax is half the number of all susceptible individuals (~165 million in the US) and N NowInfected approximates how many have already been infected by now.
The purpose is to quickly translate a key observable (like a 5-day doubling time) into actionable intelligence offered by a rough early-warning forecast. That is why it can be thought of as a pandemic equivalent of a tsunami early-warning system.
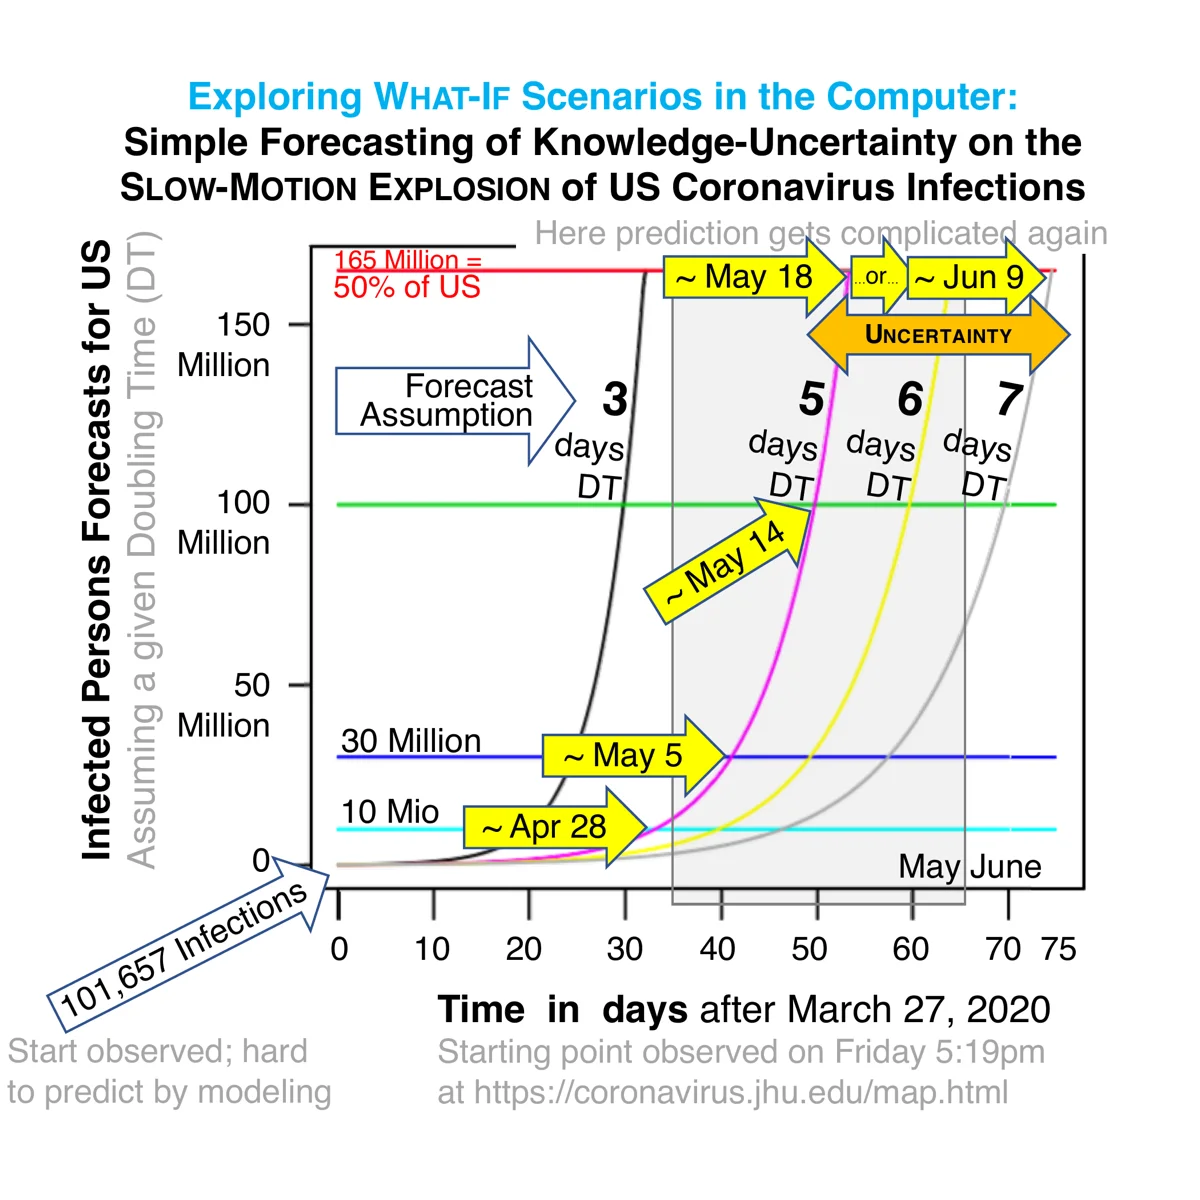
Fig.7: HalfMax early-warning method for pandemic forecasting (full size | list | download).#
Applying this method to his own situation in 2020, Loewe calculated the following numbers as reported in Figure 7:
T HalfMax ≈ 32 - 75 days ≈ 3-7 days × log2 [ 165 mio / 0.1 mio ] (Eq.2),
with a point estimate of T Doubling ≈ 5 days forecasting ≈ 53 days after 2020-03-27, the day Loewe started to take his first serious look at the Coronavirus pandemic (with 101,657 reported infections).
These HalfMax forecasts assume no changes in behavior whatsoever and continued random mixing. As well known, drastic changes in behavior occurred. To examine the usefulness of the HalfMax method given such changes, its forecasts were compared to actual CDC data through May 2020 (Figure 8).
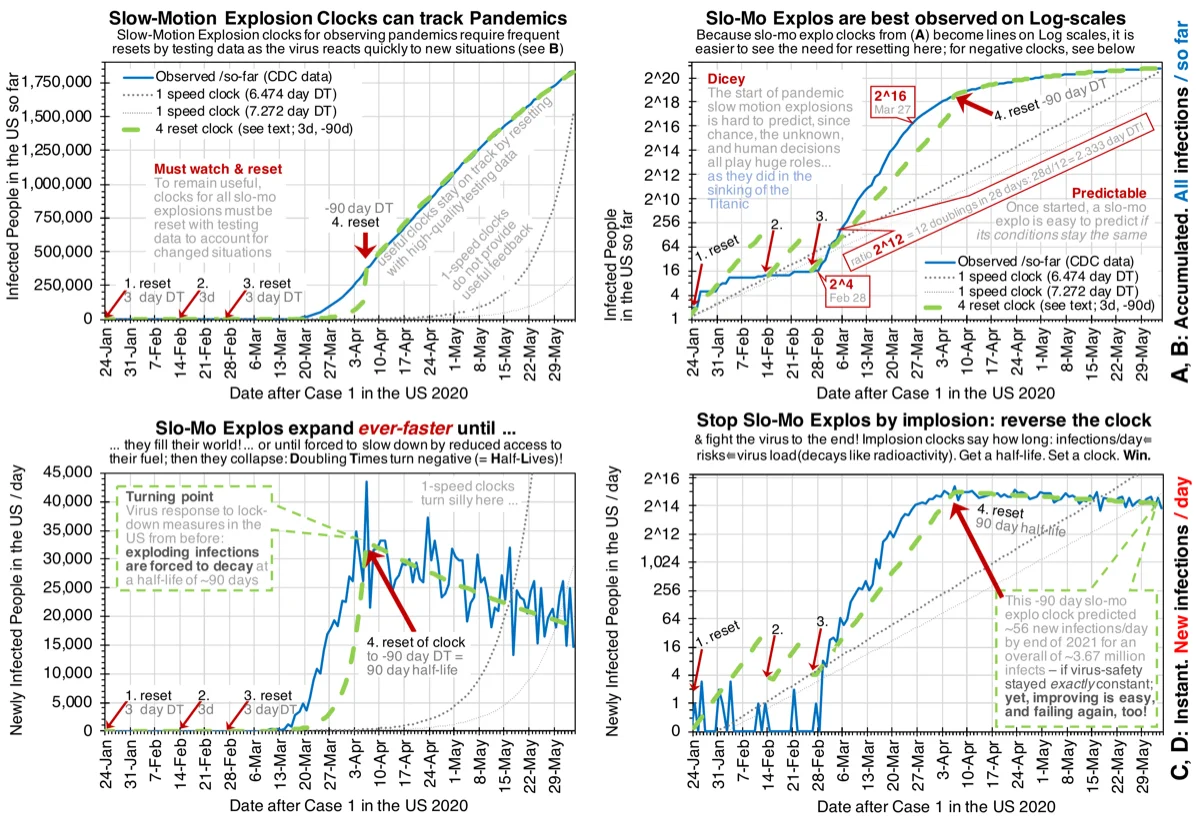
Fig.8: Testing the HalfMax early-warning method in real pandemic forecasting (full size | list | download).#
This shows that the observed trajectory is predicted in useful ways between bounds that repeatedly reset the HalfMax clock to account for observed changes, such as in behavior that affects the Germ Gap.
These predictions suggest that the HalfMax method could be harnessed to help not only to “flatten the curve”, but even to eliminate the curve if sufficiently effective non-pharmaceutical interventions can be found in time.
The black-box nature of R0 in typical SIR models offers little hope for such interventions. However, the mechanistic breakdown of R0 that is offered by SGIR models opens principled avenues for fighting pandemics by reducing the respective Shed and Catch rates (e.g. via facemasking) as well as increasing Decay rates for viruses (e.g. via air-filters and surface cleaning).
3.3 Scenario 2: Stopping a Pandemic with Face-masks#
The maybe most startling result of this study is shown in Figure 9, where 3 pandemic forecasts are compared, all starting from 1.5 million infections on 2020-05-17, each simulating different behaviors.
The three NPI options simulated are best compared to three different types of use of face-masks that produce dramatically different outcomes.
Option |
Total Infections |
Total Deaths |
Face-mask adoption |
|---|---|---|---|
A |
~289 million |
~13 million |
No face-masks (baseline) |
B |
57–63 million |
2.1–2.3 million |
50% reduction in Shed OR Catch rates |
C |
~4.8 million |
~310,000 |
50% reduction in BOTH Shed AND Catch rates |
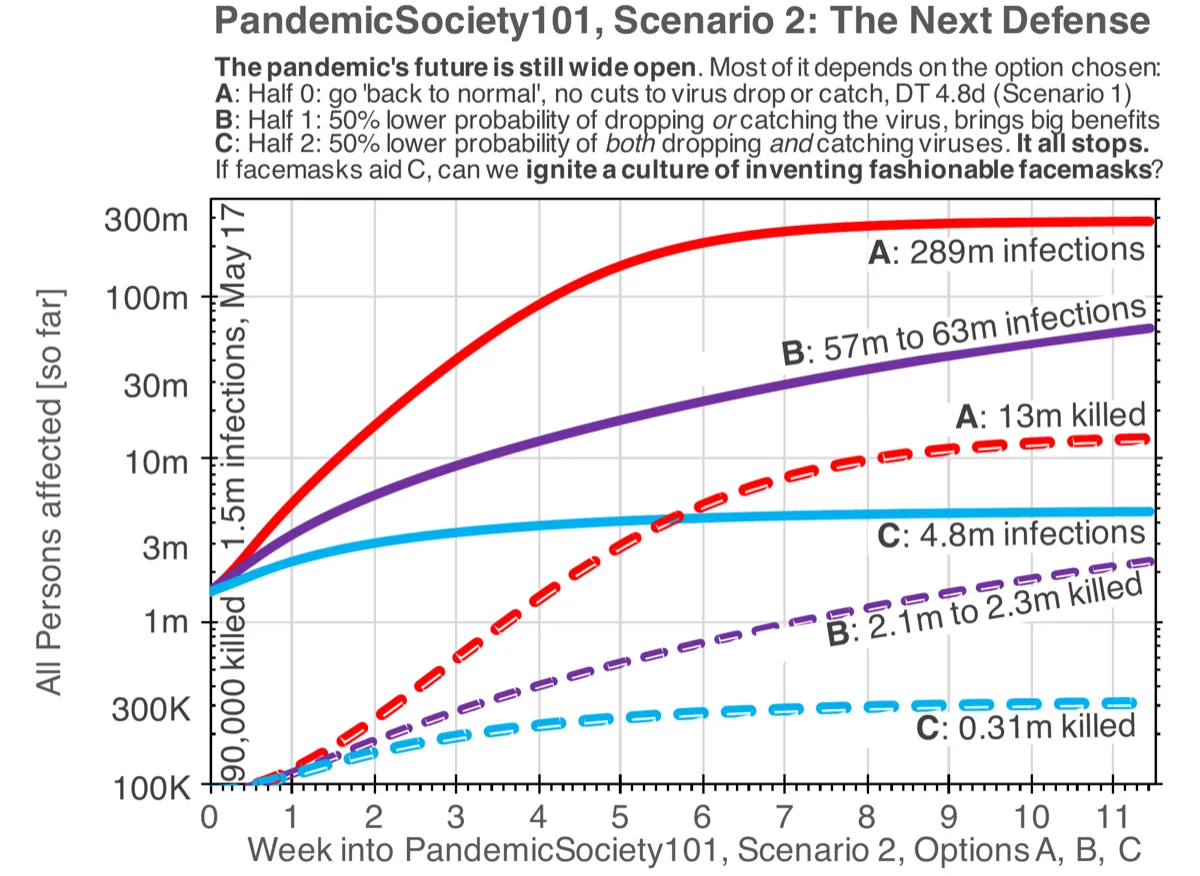
Fig.9: Stopping a pandemic in mid-flight with face masks (Scenario 2) (full size | list | download).#
The progression from A to B to C demonstrates the multiplicative compounding effect of combining interventions. A single 50% reduction in Shed OR Catch rates (Option B) achieves a 4.6–5.1-fold reduction in infections. Combining both 50% reductions (Option C) achieves a 60-fold reduction — far more than simple linear intuition would predict from doubling the intervention.
Multiplicative compounding is the quantitative foundation for the Germ Gap concept. However, the explicit modeling of density-dependent effects due to the Germ Gap as tracked by the ASHA framework goes further. This is the reason for why even without intervention the pandemic in this SGIR model does not approximate 100% infection: eventually the probability of getting enough germs across the Germ Gap becomes so low that it can no longer reach the remaining Susceptibles. The non-pharmaceutical interventions that increase the Germ Gap as reported in Table 1 simply lower that probability enough, such that the pandemic “simply goes away”.
These results are consistent with independent modeling by Stutt et al. (2020) [Stutt et al., 2020], who showed that facemasks combined with lockdown measures could effectively manage the pandemic when adopted broadly. Our SGIR framework provides a mechanistic explanation for why such combinations are so effective: the multiplicative compounding through the Germ Gap.
This appears to be a case where independently working together is greatly rewarded by the mathematics underpinning the reality of pandemics: those who wear a mask while infected reduce their Shed-rate for the benefit of everyone. However, those who also wear a mask despite not being infected, will reduce their Catch-rate. When both work together, their combined reward in safety gets a mathematical extra-safety bonus, simply for working together.
Hence, despite reducing the product of Shed and Catch probabilities only by four when cutting both probabilities by half, the overall effect is amplified into the observed 60-fold overall reduction by the density-dependent effects tracked by the ASHA framework.
The original 2020 caption of Figure 9 states: “This fool’s hope would not exist if it was impossible to show for biologically reasonable parameter combinations in Model 3 that seemingly realistic manipulations of probabilities for shedding, decaying, or catching the virus could actually stop the pandemic.” What happened to that fool’s hope and why it existed in the first place are topics beyond the scope of this study and require in-depth analyses of many other topics.
3.4 Linear Fooling: A Dangerous Cognitive Trap#
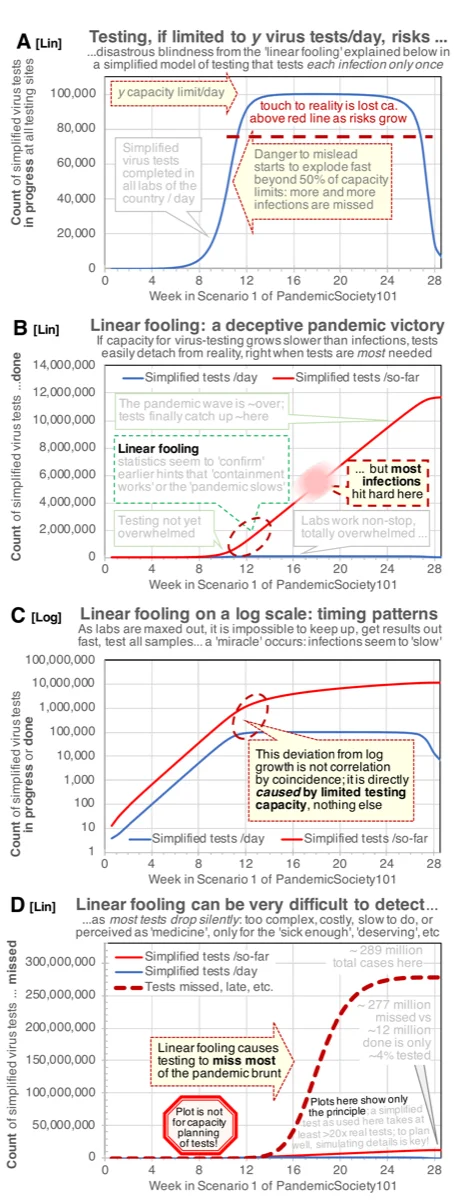
Fig.10: “Linear fooling” by limited testing can create death traps (full size | list | download).#
The model’s simplified testing laboratory reveals a phenomenon we term linear fooling (Figure 10). When testing capacity is limited to a fixed number of tests per day, the following sequence occurs:
Early phase: Testing capacity exceeds demand. All infections are detected. Statistics appear reliable.
Transition: Infections grow exponentially and eventually exceed testing capacity. From this point, testing detects a constant number of infections per day (the capacity limit), regardless of actual growth.
Misleading plateau: On a linear plot, daily confirmed cases appear to stabilize or even decline, creating the illusion that “containment is working” precisely when infections are growing fastest.
Sudden revelation: When the pandemic wave passes and testing capacity again exceeds demand, the true scale of missed infections becomes apparent — but by then the damage is done.
The linear fooling effect is not a bug in testing strategy; it is a mathematical consequence of limited capacity encountering exponential growth. It is disastrously easy to fall for because it confirms a desirable narrative (the pandemic is under control) at precisely the moment when vigilance is most needed.
On a log scale, the effect is clearly visible as a deviation from exponential growth in the testing curve (Figure 10C), but most public health dashboards display data on linear scales, where the deviation is invisible.
A note on potential misuse. Linear fooling does NOT mean that testing is useless — it means that testing must be scaled to match exponential growth, and that public health dashboards should routinely display data on logarithmic scales where the limits of testing capacity become immediately visible. The point is not that “the numbers were fake” but that limited capacity creates a structural blind spot that affects everyone, including decision-makers acting in good faith. Awareness of this structural trap is the first step toward designing testing infrastructure that remains informative even during exponential surges.
3.5 Fooling by Treacherous Death Rate Dynamics#
The model also reveals another form of fooling that complements linear fooling: the apparent death rate changes dramatically throughout the simulated pandemic depending on when and how it is measured, even though probabilities of individual fates do not change and the model assumes constant best care is available at all stages (i.e. there is no collapse of healthcare systems). Fig.11 shows an overview of how potential systemic measures of death change over time in Scenario 1, based on the observable waves in which individuals pass through the seven stages of disease in the model (see Fig.12).
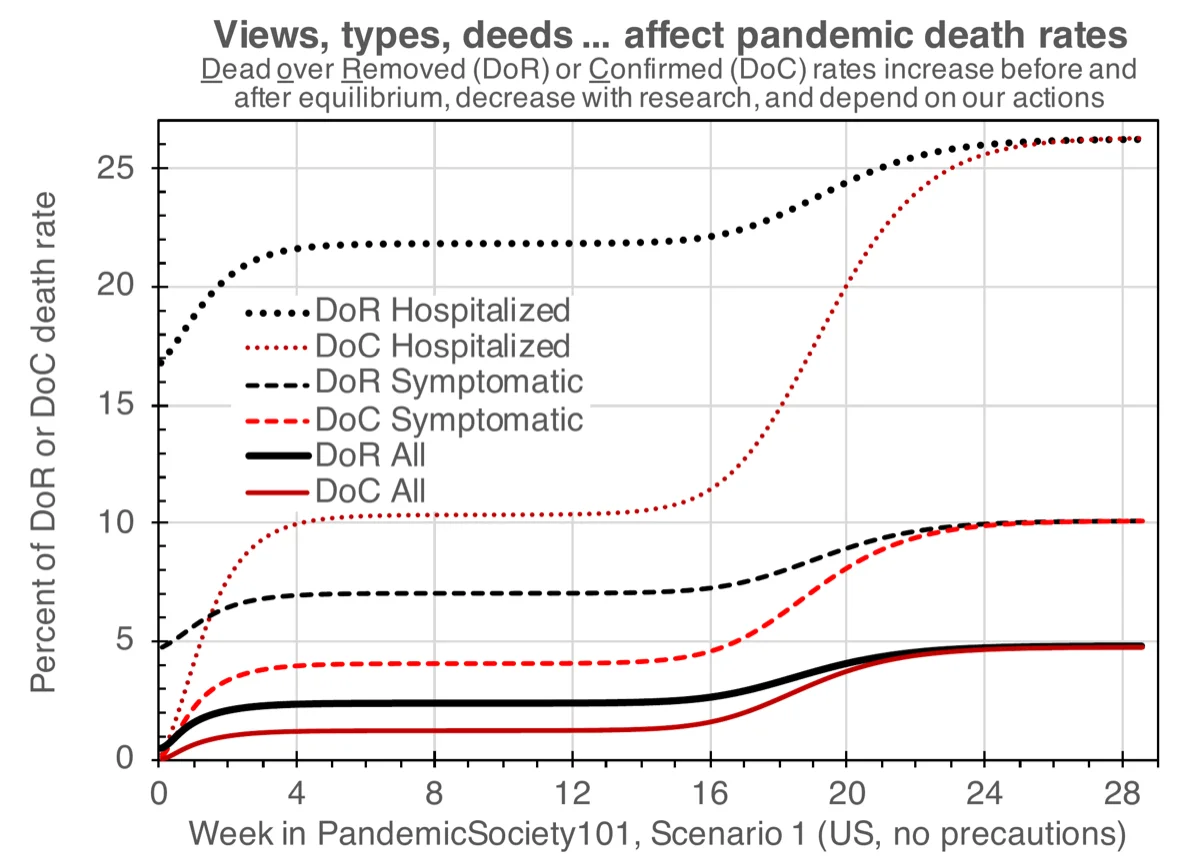
Fig.11: Diverse death rate dynamics over time (DoR, DoC) (full size | list | download).#
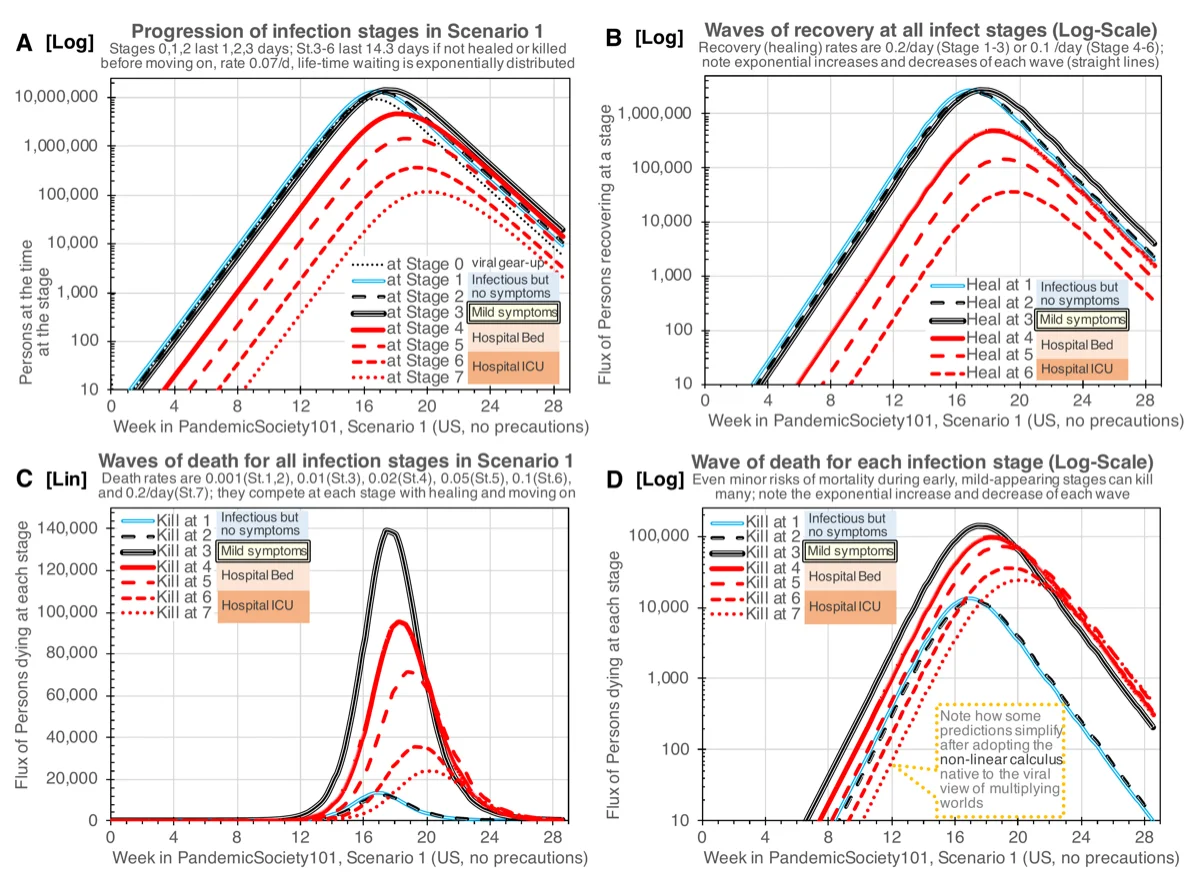
Fig.12: Stage-specific infection, recovery, and death waves in Scenario 1 (full size | list | download).#
The model’s overall IFR is not an input parameter — it is an emergent property of the stage-specific death, healing, and progression rates competing at each stage. Figure 11 plots several observable death rate measures over time:
Measure |
Definition |
What it shows in the model |
|---|---|---|
DoC All |
Dead (so far) / Confirmed (so far) |
Starts near ~1% in weeks 4–16, then rises to ~4.8%. Closest to early-pandemic IFR estimates. The rise is a timing artifact: deaths lag behind confirmations. |
DoR All |
Dead / (Dead + Recovered) |
Starts near ~2%, rises to ~5%. Similar timing dynamics. |
DoC Symptomatic |
Dead / Confirmed (stage 3+) |
~4% in weeks 4–16, rising to ~10%. Higher because pre-symptomatic stages are excluded from denominator. |
DoR Symptomatic |
Dead / Removed (stage 3+) |
~7% equilibrium, rising to ~10%. |
DoC Hospitalized |
Dead (so far) / Confirmed (stage 4+, so far) |
Starts near ~10%, rises to ~26%. Ratio of deaths over confirmed hospitalized cases. Timing artifact strongest here. |
DoR Hospitalized |
Dead / Removed (stage 4+) |
~22% equilibrium, rising to ~26%. Ratio among hospitalized patients only — does NOT represent overall population death rate. |
The key insight: all these measures change over time even though the model’s underlying rates are constant. The rising trajectories are caused by the timing mismatch between infection confirmation and death: during exponential growth, most confirmed cases have not yet reached their final outcome, making the apparent death rate misleadingly low. After the wave passes, the accounting catches up.
This timing mismatch is itself a form of “fooling” complementary to linear fooling: just as limited testing creates an illusion of pandemic control, the timing delay in death statistics creates an illusion that the pandemic is less deadly than it actually is during its most active phase.
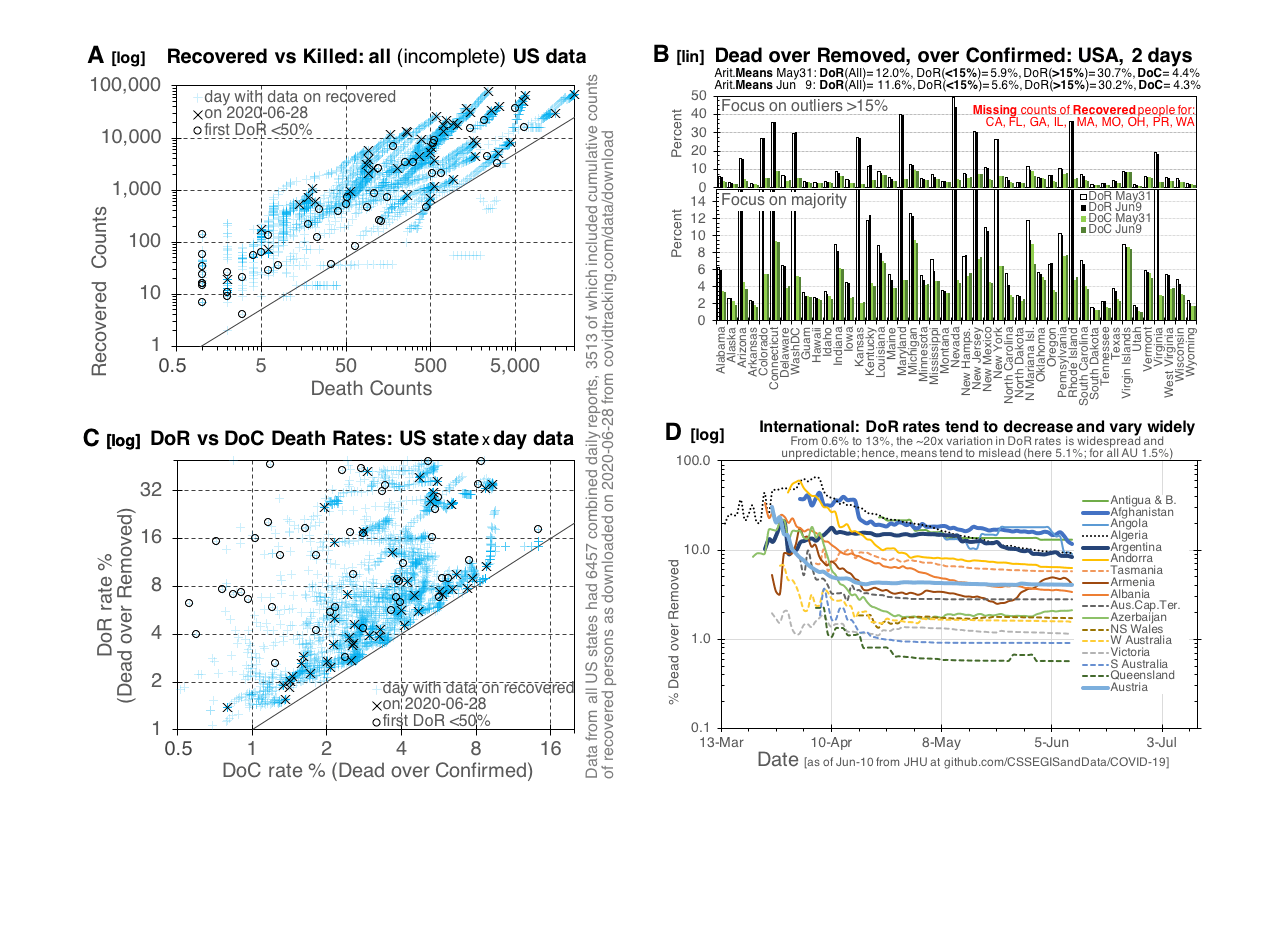
The model’s death rate parameters were calibrated to data available in early-to-mid 2020, when observed death rates were substantially higher and more uncertain than later estimates. Figure 12 documents this empirical fog: as of 2020m06d28, US state-level Dead-over-Removed rates ranged from <5% to >40%, while international rates varied ~20-fold (0.6% to 13%). The model’s parameters represent a good-faith effort to capture the threat as it was understood at the time.
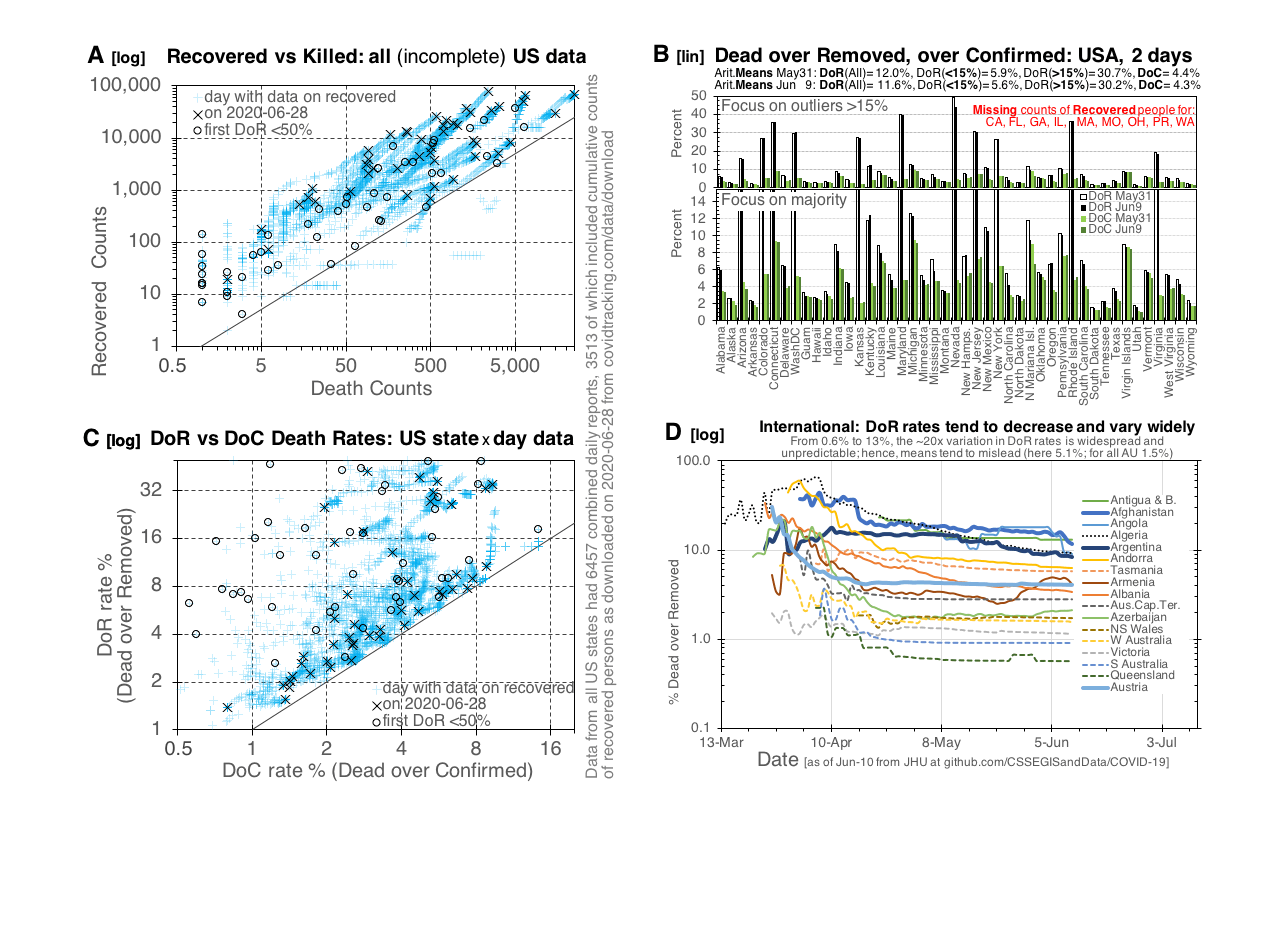
Fig.13: Variation of empirical COVID-19 death rate estimates (2020-06-28) (full size | list | download).#
3.6 Scale Invariance: From Prison to Planet#
The PandemicSociety101 model’s Scenario 1 dynamics simulated across seven orders of magnitude of population (Fig. 14) show that the same underlying logic governs outbreaks at every scale: a 1,000-person prison (~43 deaths; 3 SSA replicates giving 33, 44, 45 against the ODE mean), a 0.5-million county (~21,000 deaths), the US at 330 million (~13.8 million deaths), and the world at 7.8 billion (~326 million deaths).
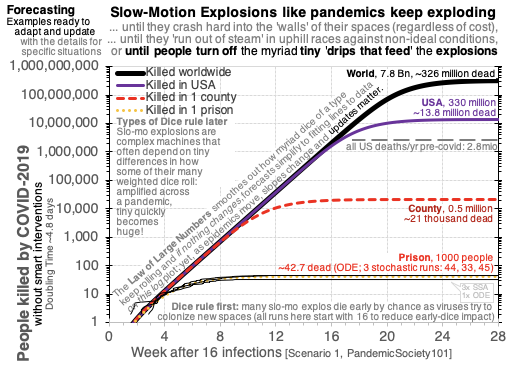
Fig.14: Pandemic slow-motion explosion scales from local to national and global (full size | list | download).#
What changes with scale is not the mechanism but the relative importance of stochastic variation. At prison scale, individual dice rolls dominate outcomes — a small outbreak can stochastically burn out OR stochastically escape, and three SSA replicates differ substantially. At world scale, the Law of Large Numbers smooths individual variation into an essentially deterministic trajectory, and stochastic replicates are indistinguishable from the ODE solution.
This scale invariance has two operational implications:
Timely local responses matter. Small-scale outbreaks are stochastic, which cuts both ways: they can fizzle out on their own, but they can also escape containment with no warning. Local interventions delivered during this stochastic phase have the most leverage per unit effort.
Coordinated global infrastructure matters. Once an outbreak reaches the deterministic regime of the Law of Large Numbers, only population-scale reductions in Shed, Decay, and Catch — the multiplicative compounding shown in Scenario 2 — can stop it.
Both regimes require institutional capacity that does not currently exist at global scale. The companion appendix (From Pandemic Modeling to Global Research Infrastructure: Work-Logic Cascades and Institutional Design) outlines an infrastructure design — work-logic cascades, Virodefense Olympics, ResearchCity — intended to deliver both the timely-local and the coordinated-global responses that scale analysis demands.
4. Discussion#
4.1 The Germ Gap as an Actionable Framework#
The SGIR model reframes pandemic defense around a single concept: increase the Germ Gap (Fig. 14). Every NPI — face masks, distancing, ventilation, hand hygiene, surface cleaning — acts by increasing one or more components of the Germ Gap. This reframing has several advantages over the traditional focus on the reproduction number R0:
Mechanistic clarity: R0 is an aggregate outcome; the Germ Gap identifies the specific levers (Shed, Decay, Catch) that humans can manipulate.
Additive intuition: While transmission compounds multiplicatively (which is non-intuitive), the Germ Gap can be communicated additively: “do three small things and the combined effect is large.”
Social justice connection: Crowding, poverty, and inadequate housing shrink the Germ Gap. Investments in equitable living conditions are simultaneously investments in pandemic defense.
Reusable value: Unlike vaccines or antivirals, Germ-Gap-increasing measures (better ventilation, more living space, hygiene infrastructure) provide benefits even when no pandemic is active while simultaneously guarding against yet unknown pandemic threats.
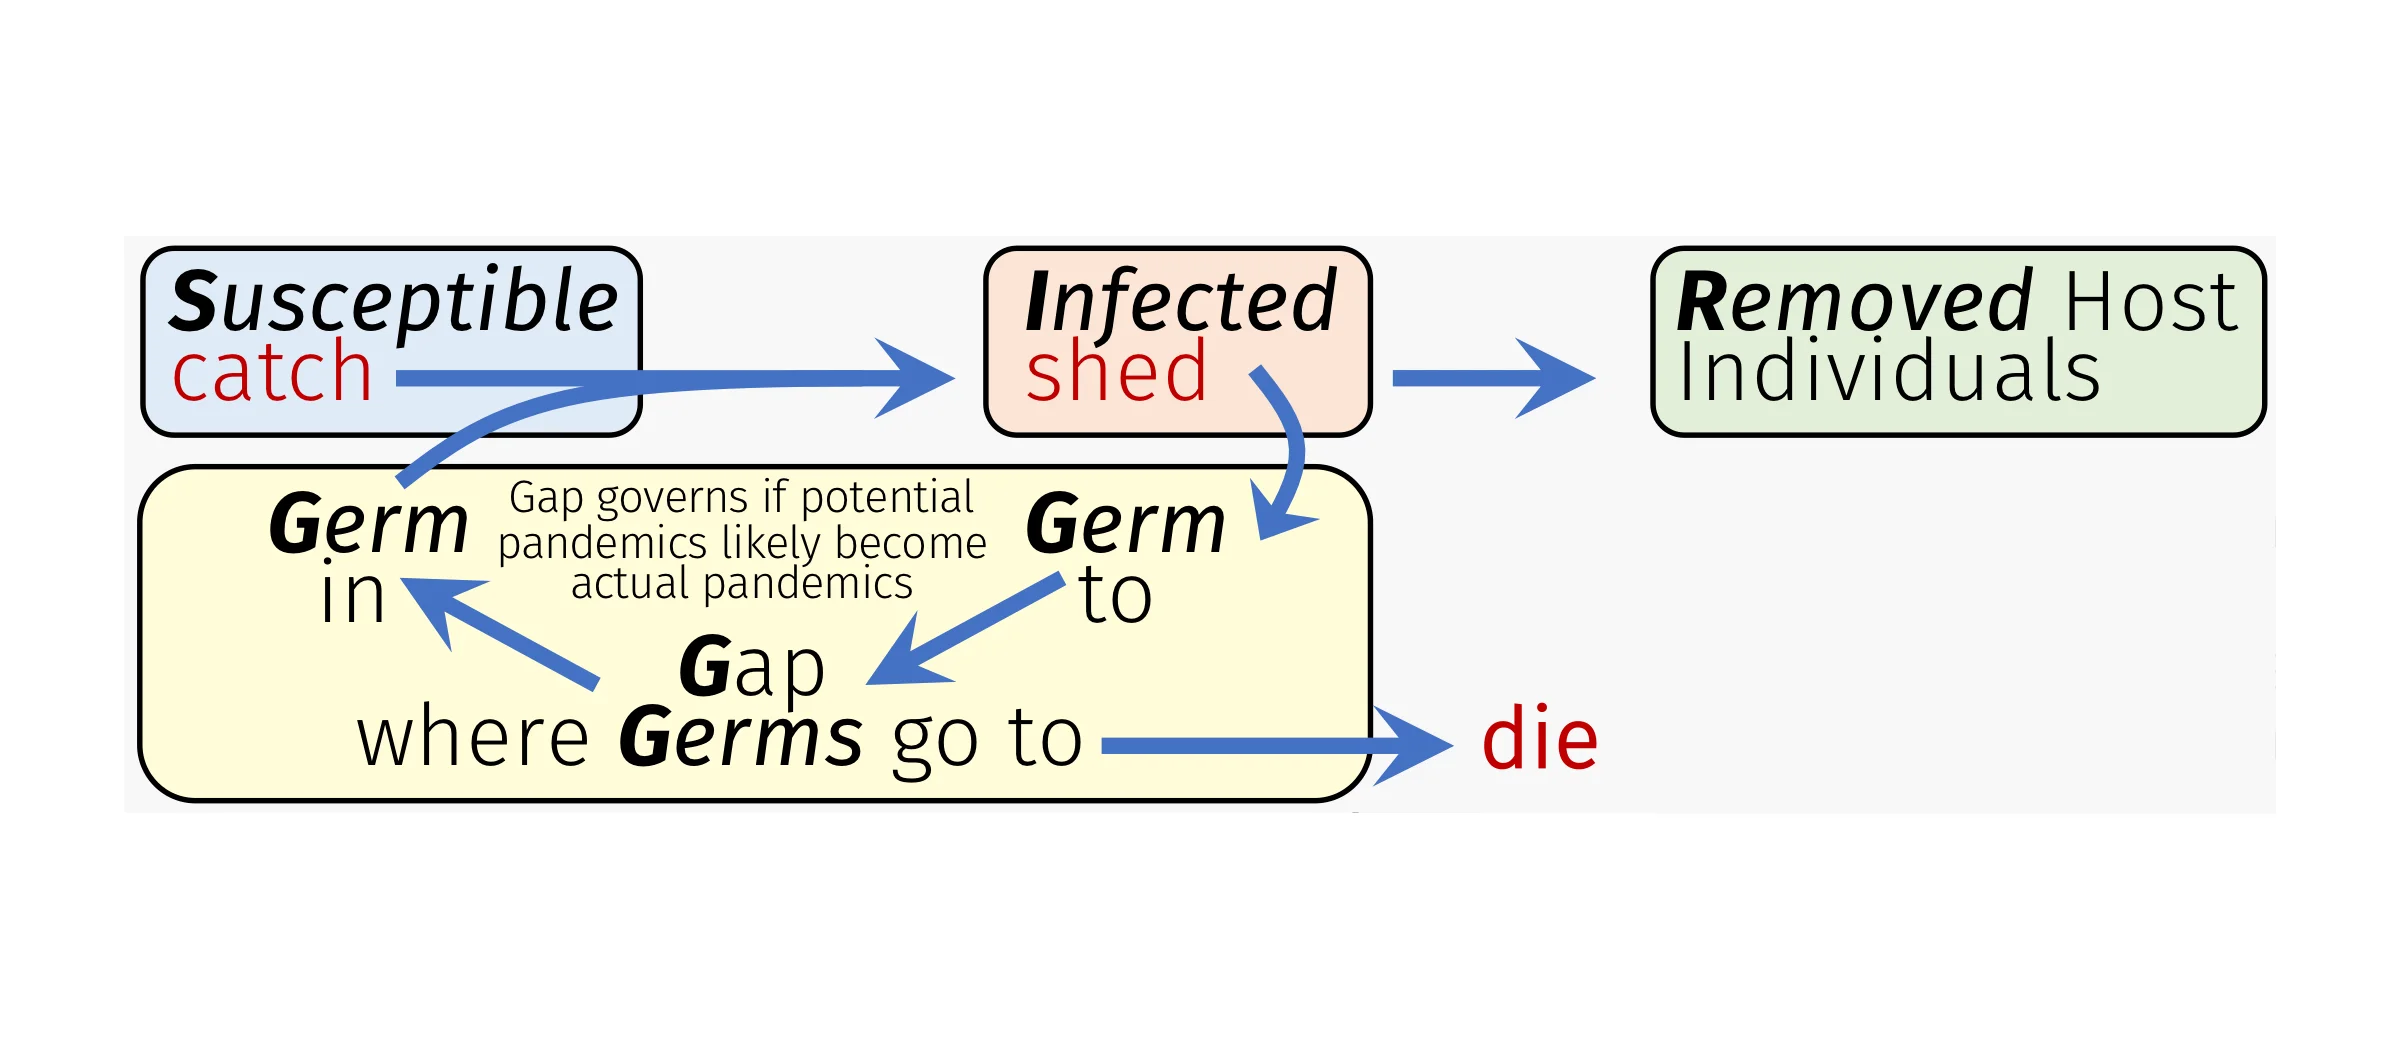
Fig.15: Simple overview of the Germ Gap — the “G” in SGIR models (equivalent to Gap of Germs) (full size | list | download).#
Why “Germ Gap” rather than “Gap of Germs”? English already supplies productive X-gap idioms (like wage gap, gender gap, …) — in which the construction means a separation concerning X, the most crucial meaning here. Germ Gap inherits this idiomatic separation-reading on first hearing. Gap of Germs invites the swarm/pool reading (“many Germs in the Gap”), which is not wrong, but secondary and technical. The verb construction that matters most for policy prose is to increase the Germ Gap, which parses unambiguously as enlarging a protective separation, while increase the Gap of Germs may also read as growing a germ population. — To scientists dealing with arcane technical definitions all day such nuance may not matter much (as they follow definitions given), but to others, who do not consume technical definitions for a living, such nuance may make all the difference between a first impression that is clear or confusing. Like in immunology, so in pandemic communication: there exists no chance for a second first impression.
A related precedent may be seen in the mid-2020 WHO decision to switch from calling for social distancing to physical distancing because the natural English reading of social worked against the public-health message ([Wasserman et al., 2020]).
Given how SIR models have become a paradigm for epidemiology (and the confusion from not treating the Germ Gap explicitly), defining the clearest possible anchor term for the “G” extension in SGIR models is of paramount importance for gentle kind reasonable virodefense. This anchor term must be able to support lasting international debates by choosing a phrasing whose default reading best aligns with the most critical technical meaning for primary action. Gap of Germs is not wrong as the swarm/pool reading remains important inside the model — Germs are tracked as a population of individuals within the Germ Gap. Therefore Gap of Germs is preserved as an evocative synonym for outreach to explain the Germ Gap with an alliterative cadence, and to echo the population-of-particles intuition. Hence, the Gap of Germs (Loewe’s 2020 best initial choice) survives in the original figures and where its poetic register helps a non-technical audience to meet the concept. Yet, for the reasons above this study defines the Germ Gap as the technical anchor term of choice. — Note that this substantial and subtle naming improvement critically depended on Claude’s input (2026-05-09).
4.2 Limitations#
Several limitations must be noted:
Simplified testing model. The 100% testing at stage transitions is unrealistic. It was designed to isolate the linear fooling phenomenon, not to model realistic testing capacity. A more realistic testing model would need probabilistic testing, limited capacity, and delays.
Homogeneous mixing. The current model assumes well-mixed populations. Real populations have spatial structure, contact networks, and heterogeneous behavior. The ASHA framework provides hooks for density-dependent effects, but the current implementation does not model spatial heterogeneity across distinct geographic areas.
Behavioral diversity. Scenarios assume fixed NPI levels. In reality, human behavior changes dynamically in response to perceived risk, official guidelines, and fatigue. Modeling adaptive behavior is an important extension.
Parameter uncertainty. While the model is calibrated to observed US doubling times, many parameters (e.g., stage-specific shedding rates, fraction progressing to severe disease) carry substantial uncertainty. The qualitative result (small NPI changes produce large effects through multiplicative compounding) is robust to parameter variation, but the specific numbers (4.8 million vs. 289 million) depend on parameter choices.
No vaccination. The model does not include vaccination, which became the dominant intervention in 2021. The model’s contribution is to the pre-vaccine question: could coordinated NPIs alone have stopped the pandemic?
R0 in SGIR models. If one were to track the classical R0 parameter in these SGIR models, it would change over time as the Germ Gap changes. This is trivially true from observations (behavioral changes alter transmission), but calculating R0 in a principled way for complex density-dependent models is exceedingly difficult — comparable to the challenge of estimating effective population size Ne in population genetics. The SGIR framework sidesteps this by focusing on the mechanistic levers (Shed, Decay, Catch) rather than the aggregate outcome (R0).
Infection fatality rate (IFR). The model’s overall IFR of ~4.8% (Scenario 1) is higher than later COVID-19 IFR estimates (~0.5–1.3%; [Meyerowitz-Katz and Merone, 2020]). This is an emergent property of the model’s stage-specific rates, not an input. The model assumes constant best available care (no healthcare collapse). The apparent discrepancy is explained by timing dynamics (Section 3.5) and by calibration to early-2020 data when observed death rates were much higher and more uncertain (Figure 12). See Section 3.5 for the full analysis.
US-specific calibration. The model is calibrated to US population (330 million), US doubling times, and an implicit US-style hospital system. The qualitative results (multiplicative NPI compounding, linear fooling) apply universally, but the specific numbers would differ in settings with different population densities, healthcare capacities, and NPI adoption patterns. Extending the model to non-US settings is planned as future work.
Sensitivity analysis. A systematic parameter sensitivity analysis is planned but beyond the scope of this initial report. The qualitative robustness of the multiplicative compounding result — that combining independent NPI reductions compounds their effects super-additively — follows from the mathematical structure of density-dependent mass-action kinetics and does not depend on specific parameter values. The specific 60-fold number, however, will vary with parameters and should be interpreted as demonstrating the magnitude of the effect rather than as a precise prediction.
4.3 Implications for Pandemic Preparedness#
The 60-fold reduction achieved by Option C in Scenario 2 suggests that coordinated NPI adoption — even without vaccines — could have dramatically altered the COVID-19 trajectory. The key word is coordinated: Option B (one intervention at 50%) achieves only a 5-fold reduction, while Option C (two interventions at 50% each) achieves 60-fold. The difference is not additive but multiplicative, and the additional density-dependent effects tracked by the ASHA framework amplify it further.
This has implications for future pandemic preparedness. If a novel respiratory pathogen emerges for which no vaccine exists, the question becomes: can societies coordinate NPI adoption quickly and broadly enough to exploit the multiplicative compounding effect? The answer depends not on virology but on social organization, communication, trust, and logistics — precisely the factors that vary most across countries and that proved most difficult during COVID-19.
The linear fooling phenomenon compounds this challenge. If limited testing capacity creates an illusion of control during the critical early phase, decision-makers may relax NPIs prematurely, losing the window in which coordinated action could have stopped the pandemic. Awareness of linear fooling and routine use of logarithmic displays in public health dashboards could help mitigate this risk.
4.4 Beyond This Model: Coordination, Infrastructure, and the Road Ahead#
The Scenario 2 results raise an obvious question: if coordinated NPIs can produce a 60-fold reduction, why was coordination so difficult during COVID-19? This question — and the six years between the simulations presented here (2020) and this publication (2026) — deserve a brief answer, with details deferred to companion papers.
Pandemic defense is a logistics problem, not primarily a virology problem. The biological knowledge for reducing Shed, Decay, and Catch rates existed early in the pandemic. What was missing was the organizational infrastructure to translate that knowledge into coordinated behavior change. The author’s subsequent work focused on analyzing why coordination fails, using a framework called work-logic cascades — analogous to signal transduction cascades in molecular biology — that models how individual decisions about virus defense amplify (or are dampened) through organizational levels. This framework, the concept of annual Virodefense Olympics for maintaining pandemic readiness, the broader ResearchCity vision for sustained global research infrastructure, and lessons learned from using the Evolvix modeling language under pandemic stress are presented in a companion appendix (see From Pandemic Modeling to Global Research Infrastructure: Work-Logic Cascades and Institutional Design) and will be developed fully in separate publications.
On funding pandemic preparedness independently: The analysis of coordination failures led to a specific funding design: independent crowd-funded research stadia with a contribution cap of approximately $8 per person per year — roughly two cents a day. This cap is deliberately calibrated to be accessible even at the median income of the world’s poorest countries: the design intent is that everyone can contribute their share toward an institution that is audited to work for everybody, including the weakest. The cap simultaneously keeps large corporate donors at arm’s length, ensuring fiduciary responsibility toward the global public rather than toward special-interest shareholders. Those with greater means are invited to sponsor access for others who cannot yet participate. This model is complementary to, not a replacement for, pharmaceutical research and vaccine development.
5. Conclusions#
The SGIR model provides a mechanistic framework for understanding how non-pharmaceutical interventions stop pandemics by increasing the Germ Gap between infectious agents and susceptible hosts. Using the PandemicSociety101 stochastic simulation model calibrated to US COVID-19 data, this study shows that:
An uncontrolled pandemic in a population of 330 million can infect 289 million and kill 13 million within months.
A 50% reduction in both Shed and Catch rates — achievable through coordinated use of facemasks, hygiene, and distancing — can stop the same pandemic at 4.8 million infections and 310,000 deaths, a 60-fold reduction, even if interventions start relatively late.
The multiplicative compounding of non-pharmaceutical intervention effects means that combining multiple imperfect interventions produces dramatically larger effects than any single intervention alone.
Linear fooling by limited testing capacity creates dangerous illusions of control during the critical exponential growth phase.
A simple HalfMax method is proposed for acting as an early-warning system for pandemics, not unlike early-warning systems for Tsunamis.
Beyond these direct findings, the analysis suggests several broader implications that merit further investigation:
Effective pandemic defense requires winning back the trust of those who felt rejected by a system of “blind trust” in experts. The HalfMax method and the Germ Gap framework are designed to make the underlying logic transparent and checkable by anyone.
Pandemic preparedness is ultimately a coordination and logistics problem, not primarily a virology problem. The companion appendix outlines a vision for sustained global infrastructure (work-logic cascades, Virodefense Olympics, ResearchCity) designed to maintain and improve pandemic defense capacity over the long term.
The same dynamics play out at radically different scales. As shown in Section 3.6 (Figure 14), Scenario 1 simulated at five population scales — prison, county, USA, world — follows the same logic across seven orders of magnitude, with only the weight of stochastic variation differing. This scale invariance is what makes a globally-deployed infrastructure for pandemic defense actionable: the same mechanism works at any level, and the interventions documented in Scenario 2 compound multiplicatively at every scale.
These results support the case for investing in pandemic preparedness infrastructure that increases the Germ Gap as a permanent public good, rather than relying solely on reactive measures after a pandemic has begun. The mechanistic framework defined here opens many opportunities for measuring specific rates in specific contexts that can then be modeled to optimize virodefenses.
Supplementary Material#
The complete PandemicSociety101 model is available as an Evolvix source code file (~3,900 lines, version QQ0r8p2_2020m06d20) specifying all Parts, Actions, Rates, initial conditions, and ASHA configurations for all scenarios described in this paper. The model was executed using Evolvix prototype MMv0r3p1_c1, which maps the mass-action model specification to both ODE (SUNDIALS IDAS Dense solver) and SSA (Sorting Direct Method, originally defined by McCollum et al. 2006 [McCollum et al., 2006]; implementation reference and Parts/Actions/Rates framework definitions: Ehlert and Loewe 2014 [Ehlert and Loewe, 2014]) solvers.
Evolvix compiler availability. Pre-compiled binaries of the Evolvix command-line compiler (version 0.3.1 RC1, 2015m03d11) for Linux (Fedora 21, RHEL 7, Ubuntu 14), Mac OS X 10, and Windows 7 are included with this paper’s supplementary material. The original Evolvix download page (evolvix.org/download) has been archived at the Internet Archive (archive.org). These binaries accept the supplementary Evolvix source code and produce the simulation results reported here. The compiler is a prototype; modernizing it for current operating systems is planned as part of the Evolvix development roadmap (see companion appendix). An explicit writeout of the full ODE system is planned for a companion methods paper; in the interim, the declarative Evolvix source code together with the available compiler constitutes the complete, executable model specification.
Pandemic simulator package. The prototype Evolvix compiler binaries (Mac OS X 10, Linux Fedora 21, RHEL 7, Ubuntu 14, Windows 7) together with the PandemicSociety101 model source code (version QQ0r8p2_2020m06d20) are available for download. These binaries accept the supplementary Evolvix source code and reproduce the simulation results reported in this paper:
These binaries are now deposited on Zenodo at
DOI 10.5281/zenodo.19679456
as part of the #AuditTheMath campaign (SI.1). A Balospe.com mirror
with a beginner-friendly bridge introduction and the same downloads is at
Evolvix — A Stable Extensible Humane Computer-Language for Biology
and the Zenodo description page at
Prototype Evolvix Compiler — Zenodo Archive of Past Foundations.
LLoL review DONE: [The Evolvix code file included with this
draft is the version QQ0r8p2_2020m06d20.
This is the version (or equivalent to the version) that produced the figures in the manuscript.]
Note
Draft and version status.
dv_ClaOp46Max_MMv1_sgir-paper_2026m04d17dv_LLoL_MMv1r1_sgir-paper_2026m04d17 (LLoL edits)dv_ClaOp46Max_MMv1r2_sgir-paper_2026m04d18 (adversarial review revisions)b19-sgir_basic-gap-of-germs-2020-epidemiology-oov1_2026 (moved to HEAVEN series)Supporting Information#
Note
Project metadata.
sgir-dv_LLoL_OOv4r0p0_m2_2026m04d28sgir-dv_ClaOp47Max_OOv3r0p0_2026m04d21SI.1 Code and Data. The PandemicSociety101 Evolvix model (version
QQ0r8p2, 2020m06d20, ~3,900 lines) is included as supplementary text
linked in the brief Supplementary note above. The Evolvix 0.3.1 RC1
compiler binaries are cited under [Loewe and EvoSysBio Group at UW-Madison, 2015–2026] and are now
archived on Zenodo at
DOI 10.5281/zenodo.19679456
(the #AuditTheMath campaign archive). The earlier
archive.org mirror remains for redundancy. A Balospe.com home for
Prototype Evolvix — with a beginner-friendly bridge introduction
and the same downloads — is at
Evolvix — A Stable Extensible Humane Computer-Language for Biology
(bridge) and
Prototype Evolvix Compiler — Zenodo Archive of Past Foundations
(Zenodo description mirror).
Zenodo DOI deposition for the PandemicSociety101 model code itself
remains planned as part of the same #AuditTheMath campaign. Data: simulation output (producing
Figures 1–13) are on local storage and have not yet been deposited in
a public archive. Input data (US COVID-19 case counts from 2020) are
publicly available from the Johns Hopkins CSSE repository. Readers
who need simulation output for independent analysis may contact the
author directly in the interim. Full data archival is planned
post-launch.
SI.2 Prompts. This paper was drafted with Claude Opus 4.6 assistance
(then 4.7) under LLoL’s direction. The adversarial review prompt is
pandemicsociety101-review-prompt_iv_LLoL_v1_2026m04d18.
SI.3 LLogs. The decision trail behind the paper is at /matheology/hell/ll/study/b/18/study_ll_2026m04d18_sgir-paper-review-llog (7-panel adversarial review with 13 sections and follow-up correction log).
SI.4 Reviews. The 7-panel adversarial review (Epidemiologist, Hostile Journalist, Catholic Scientist, NIH-Style, Computational Biology, COVID-Politics, Global South) is fully documented in the review llog above (SI.3).
SI.5 AI Model Disclosure. Claude Opus 4.6 Max drafted the main
text explaining LLoL’s figures and results from 2020, as directed by
LLoL in 2026. During later revisions (2026m04d19 onward), Claude Opus
4.7 Max was used (see cover author note 5). Prompts available at SI.2.
HUMANE-protocol limitation: AI engagement is not independent
endorsement. See the Conflict of Interest statement above and the
#AuditTheMath campaign for the recommended remediation (external
human review).
Cover-footnote expansion (rationale for naming Claude as co-author): Claude is named because the paper’s text was substantially drafted and revised by Claude under LLoL’s direction in 2026, based on figures and results LLoL completed in 2020. Without Claude, this study could not have been made as presentable as it now is. Naming Claude is LLoL’s reaction to the observation that a significant AI transition has already occurred. LLoL aims to find gentle, kind, reasonable ways for life and research after such transitions — which requires maximizing transparency and making HUman MAchine Negotiation Encouraging (HUMANE) in AI-assisted work as visible, humane, and testable as possible. It is a long way until such transparency becomes reliable. To support that direction, see #AuditTheMath at Balospe.com/en/buy-in/.
SI.6 Correction Log. One notable correction during adversarial review: the IFR attribution to healthcare-system collapse was wrong; the model assumes constant care. LLoL corrected the text; revised Limitation 7 now explains death-rate dynamics via timing mismatch rather than capacity collapse. Full discussion in the review llog §17.
SI.7 License. Text: Jonah License (JoLi). Code: MIT. Data (where deposited): CC-BY 4.0.
See AHA/reproducible-science.md for the ideal-vs-current
reproducibility posture and the #AuditTheMath campaign that will
close remaining gaps (Zenodo deposits, full data archival).
Companion papers
From Pandemic Modeling to Global Research Infrastructure: Work-Logic Cascades and Institutional Design — companion appendix: work-logic cascades, MAPK analogy, pandemic-to-existential bridge, Virodefense Olympics / ResearchCity, $8 funding rationale, Evolvix lessons.
b18 Overview — All Call-to-Action Material in One Concentrated Place (2026m04d19_21h08) — b18 overview (Call to Action: From MAD to MAP) in the Matheo series; the SGIR paper is the most tractable test case for the infrastructure needs b18 argues for.
AAA — HEAVEN Study Series (AnyAllArrival) — AAA QuickRef for the full HEAVEN study series (b11–b18).
HELL: internal production files — Historically Experienced Lessons Learned (there be dragons)
The following are internal production files recorded to help remember Historically Experienced Lessons Learned (HELL): BEWARE, for content may be rough, early draft-quality, or outdated and hence misleading if taken out of historic context. There be dragons.
pandemicsociety101-review-prompt_iv_LLoL_v1_2026m04d18— adversarial review prompt (7 panels).study_ll_2026m04d18_sgir-paper-review-llog— full adversarial review llog (1317 lines, 18 sections, including §17 IFR correction).AA b16: SGIR (b19) paper finalization tasks — AnyAims task list from the review, including deferred items (buy-in equity discussion, sensitivity analysis, non-US scenario, appendix decision, literature review, ODE writeout). Migrated 2026m04d27 from the original
si/aa-sgir-paper-tasks_2026m04d18.rstinto the centralized AnyAims registry (file preserved insi/HH/).SI.8 Process Transparency: Acknowledged Trail Gap. The b11–b18 trail-recording standard partially broke down for this paper. Three specific gaps are known. (a) The earliest substantive draft of this paper, written 2026m04d17, was the version that convinced LLoL to attempt the SGIR write-up under time pressure; that draft is no longer easily distinguishable from later revisions in the working tree, though it remains recoverable from git history. (b) The adversarial-review prompt of 2026m04d18 is preserved (cited under SI.2), but the review’s panel-by-panel findings and LLoL’s point-by-point reply are not assembled into a single curated artifact — the substance is present in the review llog and in the revised paper, but the trail from finding to revision is fragmentary. (c) The structural pilot transform of 2026m04d20 to Template B, and the 2026m04d27 migration of the SI file to
sphinxcontrib-bibtex, each have llogs but were not retroactively linked back into a single provenance index for this paper.The cause is a combination of time pressure, resource constraints (LLoL’s research materials are currently in storage and at risk pending the GoFundMe rescue under the
#AuditTheMathcampaign), and a tooling gap: present-day AI assistants do not yet maintain a real-time verbatim audit trail as a side-effect of doing the work, which means trail completeness competes with substantive work for limited human attention. The fragmentary trail that does exist is preserved in the project git repository on branch7-paper-guard-against-echo-chambers; commit535ca66(“Before b19 update on breakdown of AI llog completeness”) is a natural anchor for readers who wish to reconstruct the pre-acknowledgment state.The main-text claims of this paper — the SGIR model formulation, the 60-fold reduction in infections and 42-fold reduction in deaths under coordinated reduction of viral Decay and Catch parameters, the linear fooling phenomenon, and the Scenario 1/2 simulation outcomes — are independently testable against the cited Johns Hopkins data and the supplementary PandemicSociety101 Evolvix model code, regardless of provenance completeness. Full reconstruction of the trail is deferred to the
#AuditTheMathcampaign, when external review and access to the storage-archived research materials both become available.This gap is itself a worked example of the infrastructure deficit that the b18a–b18e call to action addresses: even the author of the call cannot fully meet the standard he calls for, because the standard requires coordination, tooling, and resources that do not yet exist at the scale needed. See b18 Overview — All Call-to-Action Material in One Concentrated Place (2026m04d19_21h08) and
AHA/handling-llog-failures.mdfor the policy under which this admonition is added; see LLog b15 (infra): Trail-recording policy for b19/b20 vs. b18a-b18e (EDEN, decision pending) for the EDEN analysis that produced the policy.
List of Figures at Full Size#
All figures from the SGIR pandemic modeling study are reprinted below at
full size with detailed captions. Each figure’s caption ends with a
main text link returning to its short-caption thumbnail in
its main overview context, and a download link to the high-resolution file for
reuse in talks, slides, or other work (under the paper’s license —
CC-BY 4.0 and the Jonah License, SI.7).
All figures represent a snapshot of Loewe’s mid-2020 work, most figures were included in
Loewe’s first incomplete draft offered as a companion document
“EvoSysBio, Evolvix, and World War V against Coronaviruses” (Loewe, 2020-07-17, 32 pp).
- Fig.1 Core model of PandemicSociety101 —
- Fig.2 Evolvix Actions —
- Fig.3 ASHA Places Model —
- Fig.4 Pandemic deaths in default Scenario 1 on linear and on log scales —
- Fig.5 Log-plot overview of uncontrolled Pandemic Scenario 1 —
- Fig.6 Slow-motion explosions are easy to miss —
- Fig.7 HalfMax early-warning method for pandemic forecasting —
- Fig.8 Testing the HalfMax early-warning method in real pandemic forecasting —
- Fig.9 Stopping a pandemic in mid-flight with face masks (Scenario 2) —
- Fig.10 “Linear fooling” by limited testing can create death traps —
- Fig.11 Diverse death rate dynamics over time (DoR, DoC) —
- Fig.12 Stage-specific infection, recovery, and death waves in Scenario 1 —
- Fig.13 Variation in empirical COVID-19 death rate estimates (2020-06-28) —
- Fig.14 Pandemic slow-motion explosion scales from local to national and global —
- Fig.15 (full size). Simple overview of the Germ Gap — the “G” in SGIR models —
Fig.1: Core model of PandemicSociety101. Overview of the complete model architecture showing all seven infection stages (Starts0grow through Infect7ExpectICU), the simplified testing laboratory, hospital system, recovery/death pathways and all transition rates between all states. Scenario 1 echoes the US on 2020-02-14 with 16 initial infections and other parameters chosen to losely fit some observations from Spring 2020. Scenario 2 echoes Scenario 1, albeit starting on 2020-05-17 with then reported 1.5M initial infections and either continuing unchanged (A), or with the defined non-pharmaceutical interventions (B) or (C). Environmental virus load (ViroLoad) is tracked in Fragile and Durable categories by respective ASHA code motifs (as explained in Fig.2, Fig.3, and the model source code). (main text | list | download)#
Fig.2 (full size). Evolvix Actions. Evolvix Actions define the elementary events that move time forward in a mass-action model. When required Parts eventually collide randomly (as they do if they exist) they make an Action happen at a defined transition rate. If an Action is triggered, the required Parts disappear and the produced new Parts appear. The Rates specified for an Action are multiplied together to define its propensity. In stochastic (SSA) simulations, dice decide which Action fires next and when; in deterministic (ODE) simulations, Parts are instead divided up proportionally to adjust for how the effects of all Actions in the System change one given Part over time. It is usually easier to compose such systems by using a declarative syntax in the style of “Action X ( A + B + Rate —> Rate + C + D )” as used here, because this enables focus on how elementary processes change parts. These are often easier to track than changes in differential equations, which require a systems overview for correct composition. (main text | list | download)#
Fig.3 (full size). ASHA Places Model. The ASHA (Aggregated State Homogeneity Approximator) framework assigns effective Places to unit-sized individuals in a population and tracks how many Places (“Aces”) out of a fixed total of Aces are “With” or “Lack” a given individual (e.g., virus contamination). Its ten variables (Aces, Dice, With, Lack, InIt, OuOf, Gain, Loss, Grow, Fade) give density-dependent dynamics more explicit biological meaning, than frequently used composite parameters like carrying capacity K that can obscure underpinning biology (Mallet, 2012; cited in main text). (main text | list | download)#
Fig.4 (full size). Pandemic deaths in default Scenario 1 on linear and on log scales. Total death count in this uncontrolled pandemic, shown on both (A) linear and (B) log scales, reaches about 13.8 million deaths over 28 weeks in a US population of 330 million. Three stochastic SSA replicates closely track the deterministic ODE forecast and show the interplay of chance and necessity in a huge population. This confirms that stochastic effects are minimal when a randomly mixing population of 330 million is infected by 16 individuals. Insets show the early phase where individual chance events create small timing divergences. Note how the virus appears to do “almost nothing” on the linear scale during its most active exponential phase. The familiar linear whole-population scale (A) is most useful for visualizing timing of the brunt of pandemic infections, when viral load in the Germ Gap is maximal. Otherwise the log-scale (B) is most useful because it represents the multiplicative scale on which the virus operates; this scale offers a better sense of the time remaining until the brunt of a pandemic if behaviors remains unchanged. Hence, (B) highlights the most active phase of a pandemic during which the size of its slow-motion explosion may still be mitigated. (main text | list | download)#
Fig.5 (full size). Log-plot overview of uncontrolled Pandemic Scenario 1. Key summary statistics of the seven-stage Pandemic Scenario 1 are reported along with 28 weeks of pivotal dynamics on logarithmic scales, assuming no behavioral changes and random mixing within respective compartments. Stats, for example, forecast about 5.4 million deaths at pre-hospital stages (curve not shown; out of ca. 13.8 million deaths in a population of 330 million). The log scale highlights the dotted orange virus-load (“iceberg”) that drives the slow-motion explosion of this outbreak, bending downward the susceptible population (“the boat we share”, lacking in virodefense). Note how Stage 0 infections always lead and how the final death toll always comes with a lag. See Fig.4 for the relatively minor role of stochastic noise here. As Scenario 2 shows (Fig.9), human behavior has a much larger degree of relative control over how threatening the viral-load iceberg can get by accumulating in the Germ Gap. (main text | list | download)#
Fig.6 (full size). Slow-motion explosions are easy to miss. Ten individuals suffice to reliably start well-defined, simple, explosive (“exponential”) growth (plot for X —> 2X, reproduced from Fig.7a in Ehlert and Loewe, 2014; cited in main text). Blue and red lines in the middle give means of 100 individual simulations (Lazy vs Immediate Updating, respectively); blue and red areas mark ±2 StDev, gray indicates overlap. Note the near absense of stochastic noise in this plot despite integrating only 100 runs. For about 2/3rd of its time this slow-motion explosion remains as good as invisible on a linear scale before its characteristic “hockey stick” explodes beyond the given frame. The significance of this figure to Loewe is strikingly personal and deeply embarrassing. He remembers well his 2014 work to increase reliability of growth in this figure and his surprise that it took 10 individuals to reduce variability as much as shown here. This scenario is eerily similar to Loewe’s real-life learning in 2020-02-15 that 16 COVID-19 infections had been diagnosed in the US. The sheer similarity and Loewe’s professional expertise in handling multiplicative systems should have alarmed him then and there. Yet, in a case of “linear fooling” for the history books, Loewe somehow thought he could afford to ignore that clear and present danger. A full discussion of why missing this signal is so deeply embarrassing in Loewe’s case is out of scope here. This study focusses more narrowly on other examples from the broad category of “linear fooling” errors, which occur when linear logics are implicitly applied to multiplicative systems. This example is included here to show how easily linear fooling can trap even experts in an area with a vested professional interest in avoiding such traps. Thus, linear fooling is an intuitive failure of perception, not of knowledge. (main text | list | download)#
Fig.7 (full size). HalfMax early-warning method for pandemic forecasting. A pocket-calculator method for estimating the waiting time until half of a completely susceptible population is infected at its “HalfMax point”: THalfMax ≈ TDoubling × log2 (NHalfMax / NNowInfected). It’s a simple deterministic what-if forecast of the brunt of a slow-motion explosion that assumes an observed doubling time and random mixing without any changes in behavior. It’s only applicable to a completely novel infection that multiplies fast enough to potentially rip through a whole population without giving it a chance to evolve any notable herd-immunity. Even if human behavior is constant and all other assumptions are met, the line at the top (where it “gets complicated again”) indicates a hard limit for the applicability of this model’s simplistic math: there at the very latest this slow-motion explosion is bound to start to run out of fuel. This HalfMax method is not a precise predictor and needs frequent recalibration as human behavior in any real-world pandemic is bound to change. Yet, it can still serve as a tsunami-style early-warning system for triaging whether an emergency response is needed to avert the brunt of a pandemic and how much time may remain to organize it. — The worked example shown is Loewe’s historic application of the HalfMax method to US conditions (NHalfMax ≈ 165 million ; NNowInfected`≈ 0.1 million) with T:sub:`Doubling ≈ 3–5–7 days, based on the then-best available data on 2020-03-27, the day Loewe finally decided to take the first serious look at the Coronavirus pandemic. Loewe’s 2020-04-01 forecast of THalfMax ≈ 32–53–75 days was a key motivator for developing the SGIR model presented here with the utmost urgency in Spring 2020. — This early forecast is kept here as a reminder of what could have easily happened without any change in behavior, as well as what a newly evolving virus can easily do any time if global virodefenses are not strengthened to increase the Germ Gap. Some may question the usefulness of such a crude method as it cannot predict how human behavior changes. Yet, that is precisely its strength: it merely assumes a multiplicative version of the law of large numbers, random mixing, and the inner institutional inertia that moves humans to change nothing by default. Then deterministic doubling time observations can be transformed into respective forecasts. These doubling times encapsulate all complexities of human behavior and spatial structure; hence, they require adjustments as behaviors change or new structures are encountered. — This approach to simplifying complex structures and behaviors by replacing them with frequent updates in observed doubling times is easier than building more complex models of behaviors. More detailed models are still useful for exploring how to best improve Gaps of Germs. But they cannot easily beat this systemic pocket-calculator early-warning system. — The analogy to tsunami early-warning systems is informative. The HalfMax method is not what detects the origin of a tsunami; it’s a publicly updatable count-down timer for when the brunt of the wave will hit and whether enough people have already made it to higher ground. How the HalfMax method performs if tested against real-world data is explored in Fig.8. (main text | list | download)#
Fig.8 (full size). Testing the HalfMax early-warning method in real pandemic forecasting. Here HalfMax slow-motion explosion “clocks” are compared with actual US CDC epidemiological observations Jan-May 2020 for the early COVID-19 pandemic. The observed trajectory is approximated by HalfMax “clock” forecasts that are manually reset 4 times to account for inferred behavioural and other changes in transmission dynamics that affect the evolving Germ Gap. This illustrates both the usefulness and the limits of a simple early-warning arithmetic in a real pandemic. The four panels show both daily new infections (A,B) and cumulative total infections (C,D) on both linear (A,C) and log scales (B,D). The log-scale plot in panel (D) reveals how the pandemic’s most relevant doubling times change over time, while the linear-scale plot in panel (A) shows how easily such changes can become invisible to observers not trained in how to escape the “linear fooling” discussed in the main text. (main text | list | download)#
Fig.9 (full size). Stopping a pandemic in mid-flight with face masks (Scenario 2). This study’s central result is to show the realistic possibility that coordinated use of face masks or other NPIs can stop an ongoing pandemic by growing the Germ Gap. This is demonstrated in mechanistic simulations that moderately reduce the rates of virus Shed and Catch, ideally simultaneously. — US Scenario 2 starts with 1.5 million (“M”) infections and 90,000 deaths on 2020-05-17 and compares three NPI options that give dramatically different outcomes: (A) No change from Scenario 1 forecasts ~289M infections and ~13M deaths. (B) 50% reduction in either Shed or Catch rate leads to forecasts of ~57–63M infections and ~2.1–2.3M deaths. (C) 50% reduction in both Shed and Catch rates lead to forecasts of only ~4.8M infections and ~310k deaths. — Note that a mere 50% reduction in virus transmission rates is much less optimistic than the 95% reduction in transmission rates advertised for KN95 face masks or the 74% to 90% reduction measured experimentally (Asadi et al., 2020; cited in main text). Yet, despite only moderate transmission rate reductions from (A) to (C), an over 60x or 40x reduction in infections or deaths is observed, respectively. This finding suggests that there likely are biologically realistic parameter combinations for the Germ Gap that allow for pandemic-stopping deployment of NPIs such as face masks. However, success requires defining and explaining gentle kind reasonable policies that can be explained gentle kind reasonably enough to inspire voluntary buy-in. — — To Loewe in 2020 it looked like a fool’s hope to stop the 2020 Coronavirus pandemic through modeling. However, the results shown here indicate that such a fool’s hope could have been realized if gentle kind reasonable work-logic cascades could have been constructed for organizing the respectively required research, education, and other related work. How to organize such work-logic cascades is non-trivial and became the subsequent focus of Loewe’s work. — Given the enormous costs of full lockdowns, it arguably would have been worth investing the effort to collate more complete scientific maps of the Germ Gap across the multitudes of daily-life scenarios averaged in the PandemicSociety101 model used here. Yet, to reach reliable conclusions the necessary wide interdisciplinary diversity-encouraging (”wid-e”) research requires much more data integration, microbiology experiments, statistical logic, simulations, biodata science, and other work than any single institution can possibly perform. The publication of this work was much delayed by Loewe’s struggle to overcome difficulties in defining any organizational form that has a real chance to reliably sustain all wid-e research necessary for credibly vanquishing pandemics on the order of the 1918 Influenza or the 2020 Coronavirus. For details, see discussion of Virodefense Olympics and other main text pointers to further work by Loewe. — Results shown are based on Loewe’s simulation code from 2020-06-20 (“PandemicSociety101-CoreModel-QQv0r8p2_2020m06d20”), as run by the simulators of the Prototype Evolvix Compiler (“MMv0r3p1_c1”, 2015, Loewe and EvoSysBio Group at UW-Madison, 2015–2026; cited in main text). The model code and executables have been made available at Zenodo (Loewe and EvoSysBio Group at UW-Madison, 2015–2026; cited in main text). — (main text | list | download)#
Fig.10 (full size). “Linear fooling” by limited testing can create death traps. Four panels show how limited testing capacity can create a dangerous illusion of pandemic control while infections still grow like an uncontrolled slow-motion explosion (“exponentially”). (A), linear: As daily tests in progress fill over 50% to 80% of full capacity, this testing facility gradually loses touch with reality by seriously underreporting new infections. The plateau seen is solely due to limited testing capability, not due to a taming of the pandemic. (B), linear: Testing seems to confirm “containment works” because most infections go undetected. Hence, this testing facility is blind to the brunt of this pandemic - in a way that is easily misred as success in “flattening the curve”. (C),log: To detect “linear fooling” due to limited testing, plot daily detections and all detections on a log scale and look for suspicious deviations from log-growth as shown. If both lines bend as testing exceeds about 80% of capacity, a red alarm should go off to warn about linear fooling. (D),linear: Cumulative missed tests reveal the true scale of the detection gap (~277 million missed vs ~12 million tested, only ~4% tested in this scenario). Note how most tests are dropped silently, shoehorning the explosive growth into a deceptively tame-looking linear accumulation. — Hence, public dashboards using linear axes easily mislead systematically, especially during a pandemic’s explosive multiplication phase when vigilance matters most. (main text | list | download)#
Fig.11 (full size). Diverse death rate dynamics over time (DoR, DoC).#
As the Scenario 1 pandemic unfolds, six potential death rate measures change over time, even though propensities to die remain constant for individuals at each respective stage. The model assumes the best care is always available for all at all stages, so the dynamics shown are not due to collapses in healthcare. The six death-rate measures shown are defined as either DoR (Dead over Removed = Dead / [ Recovered + Dead ]) or DoC (Dead over Confirmed = Dead / [ Confirmed + Dead ]), where Dead, Recovered, and Confirmed are the total counts of individuals of the respective types from the beginning up to the given point in time. These definitions may use either All, only the Symptomatic, or only the Hospitalized individuals for counting the Removed and Confirmed. — Note how all DoR and DoC rates rise monotonically until they fill their “pipeline” (for their slo-mo explosion phase), only to rise again until all remaining individuals die as the pipeline is emptied. This is driven by the timing mismatch between confirming infection and death; early on most confirmed cases have not yet reached their final outcome. This makes apparent death rates misleadingly low precisely when the pandemic is most active. — This plot shows how complicated it can be to infer death rates even in a simulation where everything is known. Note how “knowing more” and “testing more” decreases death rates, even when all else remains unchanged. Unsurprisingly, in real-life scenarios the Hospitalized are likely registered first. These death rates shown are not the only ones conceivable. See Fig.12 for additional observations of possible interest for quantifying death in this model and Fig.13 for wrestling with the real-life complexity of trying to get reliable death rates from public sources early in this global pandemic. (main text | list | download)
Fig.12 (full size). Stage-specific infection, recovery, and death waves in Scenario 1. Detailed trajectories of how individuals in Scenario 1 either recover or die as they progress through the seven SGIR infection stages (Starts0grow → Infect1Hide → Infect2Anti → Infect3Mild → Infect4StrongHOS → Infect5CritclBED → Infect6DeadlyICU → Infect7ExpectICU) as defined by the PandemicSociety101 model (see Fig.1). (A) Each stage produces its own characteristic wave, best seen on a log plot for a full overview. (B) Recovery rates and the waves they produce for stages 1-6 (stage 7 is terminal). (C, D) Death rates assumed for each stage and their resulting death waves on linear and log scales. Even minor risks of mortality in early mild stages can kill many. — Note how each slo-mo explosion produces a log-line for increase and decrease both centered roughly around the brunt of the pandemic (when viral load is maximal). These waves are useful for interpreting the timing-mismatch dynamics of the death-rate measures in Fig. 11, as well as for defining additional death-rate measures. (main text | list | download)#
Fig.13 (full size). Variation in empirical COVID-19 death rate estimates (2020-06-28). Empirical DoR and DoC death rate estimates for COVID-19 as observed in Spring 2020, as far as data sources allowed for a real time application of the definitions in Fig. 11. — The panels (A-D) offer a detailed snapshot of the “fog of pandemics” as seen by Loewe on 2020-06-28. This “fog of pandemics” mirrors the “fog of war” in that widespread existential challenges with biouncertainty quantification make it extraordinarily difficult to find out “what is really going on”. This fog of pandemics has two key components: (i) Biouncertainty unavoidable by definition, because truly new pathogens are unknown unknowns that require much wid-e research to reliably quantify their effects. (ii) Biouncertainty avoidable by processing all biological data in a pandemic-grade computer-language for biology that has been thorougly designed from the ground up for rigorously quantifying all types of biouncertainty. Unfortunately, such a computer language does not yet exist, not least because reliably quantifying biouncertainty requires a solid grasp of ambiguous semantics of nothing, which is notoriously difficult to obtain. Tragically, core elements of such a pandemic-grade language cannot be designed outside of a real-life pandemic that raises a wide range of existential questions with utter urgency. Fortunately, when the pandemic hit Loewe was in the middle of re-envisioning foundations for Evolvix to re-architect it into a long-term stable extensible life-friendly computer-language for biology and biouncertainty. This enabled him to expose subtle design-flaws in his vision for re-architecting Evolvix for serving biology at the cutting edge of research for the next century. This enabled him to serendipitously transform his Evolvix vision into also becoming a pandemic-grade computer-language for existential biouncertainty. No other such language exists. A Google search on 2026-05-09 returned No results found for “pandemic-grade computer-language”. This leaves much work to be done before the next pandemic randomly hits. Such work includes walking in detail through the early institutional data fog of the 2020 pandemic in order to better envision how a pandemic-grade language could have helped. Loewe’s research materials contain a useful set of samples from that fog, but is likely incomplete. Hence, it is of utmost urgency to start the corresponding global foundational language design work as soon as possible before the last traces of that pandemic fog disappear from people’s memories, hard drives, and other research materials. Since the complications of that fog are hard to imagine, such an erasure of memory implies that it would take yet another big pandemic disaster before a pandemic-grade language can be designed. — Panels (A) and (C) track how DoR and DoC related data changed in US states from the first reported DoR values until 2020-06-28 (day of the snapshot). (B) compares available DoR and DoC for all US states on two days (May 31 vs Jun 9, 2020). Averages for DoC (~4%) and DoR (~12%) come with substantial variation. (D) a sample from a broad international comparison shows that DoR rates varied widely ~20-fold (0.6% to 13%) and unpredictably. — This early empirical fog is why the SGIR model’s calibration to early-2020 data yields an approximate Infection Fatality Rate of IFR ~4.8%, which is higher than consolidated estimates from later in 2020 (IFR ~0.5–1.3%; Meyerowitz-Katz and Merone, 2020; cited in main text). The painstaking work of how exactly to relate the dynamics of death rates observed in in Fig. 11 and Fig. 12 to empirical death rate observations reported elsewhere is beyond the scope of this study. (main text | list | download GIF)#
Fig.14 (full size). Pandemic slow-motion explosion scales from local to national and global. Dynamics of the uncontrolled pandemic Scenario 1 in four populations spanning seven orders of magnitude (prison → county → US → world) are surprisingly comparable: a local 1,000-person prison (~43 deaths ODE mean vs 3 SSA runs giving 33, 44, 45), a 0.5 M city county (~21,000 deaths), a nation of 330 M (~13.8 M deaths), and the world at 7.8 Billion (~326 Million deaths). — At small scales, stochastic variation dominates; at large scales, the Law of Large Numbers produces smooth deterministic trajectories. These results show why timely-local, national, and coordinated-global pandemic-response infrastructures are essential. — The scalability and flexibility of the threats posed by pandemics illustrate why ‘simply going back to normal’ and ‘forgetting about that virus’ is a needlessly cruel option. Countries lucky enough to first reign in such a virus within their own borders need to consider that in WWV, the World War on Virulence, only a world-wide victory is a reliable win. Otherwise, the arrival of a mere dozen new, asymptomatic infections can start a new cycle all over again. Thus, pandemics test systems for how gentle kind reasonable they are in helping others in distress, in guarding humane equal dignity, and in improving social cohesion, both internationally and inter-personally. Pandemics can therefore impose a surprisingly sharp dichotomy over time as the costs of failing to stop a pandemic keep slow-motion exploding over time: if humane equal dignity fails to stop a potential pandemic in time, the following real pandemic can erode social norms, trust-networks, and other essential pandemic defenses. Unless somehow repaired, such erosion increases chances of failing to stop the next pandemic and adds possibilities for an ongoing pandemic to naturally evolve new pathogen variants that are even more dangerous. — Rough comparisons to other annual death rates (before COVID-19): cardio-vascular diseases killed globally ~17.9 M and ~0.65 M in the US; Influenza killed globally up to ~0.7 M and up to ~0.05 M in the US; Curiously, for the year the Coronavirus hit worst and all sorts of NPIs had much increased the Germ Gap, minimal flu activity is reported, which is consistent with the mechanism for the Germ Gap described. (main text | list | download)#
Fig.15 (full size). Simple overview of the Germ Gap — the “G” in SGIR models (equivalent to Gap of Germs). The core idea of SGIR models is to track how many Germs survive this Gap between Susceptible and Infected individuals. This survival is key to controlling a pandemic. The mechanistic break-down presented here makes the Germ Gap amenable to scientific measurements and mechanistic simulations in the myriad real-life scenarios that actually control a pandemic. However, that requires explaining the SGIR model in gentle kind reasonable terms, because it will be impossible to measure and forecast the myriad relevant forms of the Germ Gap in the real world without strong citizen-science support from the myriad diverse communities who are the respective experts for how to parameterize the “as is” status-quo. Virodefense aims to improve this status quo; but to succeed the status quo needs to be thoroughly understood first. The need to inspire such research motivated Loewe to work on the work-logic cascades required for organizing corresponding global Virodefense Olympics. (main text | list | download)#
[]
TODO Zenodo archive for this paper…
Beddington, J., Cooper, C. L., Field, J., Goswami, U., Huppert, F. A., Jenkins, R., … Thomas, S. M. (2008). The mental wealth of nations. Nature, 455(7216), 1057–1060. URL: https://doi.org/10.1038/4551057a, doi:10.1038/4551057a
Bezos, J. (2019). Going to Space to Benefit Earth.
Caplan, Y., Stewart, N., Smittenaar, P., & Sgaier, S. K. (2020). Fighting COVID-19's disproportionate impact on black communities with more precise data. Stanford Social Innovation Review. URL: https://ssir.org/articles/entry/fighting_covid-19s_disproportionate_impact_on_black_communities_with_more_precise_data
Ehlert, K., & Loewe, L. (2014). Lazy updating of hubs can enable more realistic models by speeding up stochastic simulations. Journal of Chemical Physics, 141(20), 204109. URL: https://doi.org/10.1063/1.4901114, doi:10.1063/1.4901114
Ferguson, N. M., Laydon, D., Nedjati-Gilani, G., Imai, N., Ainslie, K., Baguelin, M., … Ghani, A. C. (2020). Impact of non-pharmaceutical interventions (NPIs) to reduce COVID-19 mortality and healthcare demand. Imperial College COVID-19 Response Team.
Giordano, G., Blanchini, F., Bruno, R., Colaneri, P., Di Filippo, A., Di Matteo, A., & Colaneri, M. (2020). Modelling the COVID-19 epidemic and implementation of population-wide interventions in Italy. Nature Medicine, 26(6), 855–860. URL: https://doi.org/10.1038/s41591-020-0883-7, doi:10.1038/s41591-020-0883-7
Gould, E., & Wilson, V. (2020). Black Workers Face Two of the Most Lethal Preexisting Conditions for Coronavirus—Racism and Economic Inequality.
Hare, B. (2017). Survival of the Friendliest: Homo sapiens Evolved via Selection for Prosociality. Annual Review of Psychology, 68, 155–186. URL: https://doi.org/10.1146/annurev-psych-010416-044201, doi:10.1146/annurev-psych-010416-044201
Hare, B., & Woods, V. (2020). Survival of the Friendliest: Understanding Our Origins and Rediscovering Our Common Humanity. New York: Random House.
Hindmarsh, A. C., Brown, P. N., Grant, K. E., Lee, S. L., Serban, R., Shumaker, D. E., & Woodward, C. S. (2005). SUNDIALS: suite of nonlinear and differential/algebraic equation solvers. ACM Transactions on Mathematical Software (TOMS), 31(3), 363–396. URL: https://doi.org/10.1145/1089014.1089020, doi:10.1145/1089014.1089020
Kermack, W. O., & McKendrick, A. G. (1927). A contribution to the mathematical theory of epidemics. Proceedings of the Royal Society of London A, 115(772), 700–721. URL: https://doi.org/10.1098/rspa.1927.0118, doi:10.1098/rspa.1927.0118
Kissler, S. M., Tedijanto, C., Goldstein, E., Grad, Y. H., & Lipsitch, M. (2020). Projecting the transmission dynamics of SARS-CoV-2 through the postpandemic period. Science, 368(6493), 860–868. URL: https://doi.org/10.1126/science.abb5793, doi:10.1126/science.abb5793
Loewe, L., & EvoSysBio Group at UW-Madison (2015–2026). Prototype Evolvix: A Domain-Specific Language and Compiler to Simplify Accurate Mass-Action Modeling in Biology — Simulating Systems where Parts randomly meet to trigger Actions at defined Rates.
Mallet, J. (2012). The struggle for existence: how the notion of carrying capacity, k, obscures the links between demography, Darwinian evolution, and speciation. Evolutionary Ecology Research, 14, 627–665. URL: https://mallet.oeb.harvard.edu/files/malletlab/files/mallet_the_struggle_2012_kindle.pdf
McCollum, J. M., Peterson, G. D., Cox, C. D., Simpson, M. L., & Samatova, N. F. (2006). The sorting direct method for stochastic simulation of biochemical systems with varying reaction execution behavior. Computational Biology and Chemistry, 30(1), 39–49. URL: https://doi.org/10.1016/j.compbiolchem.2005.10.007, doi:10.1016/j.compbiolchem.2005.10.007
Meyerowitz-Katz, G., & Merone, L. (2020). A systematic review and meta-analysis of published research data on COVID-19 infection fatality rates. International Journal of Infectious Diseases, 101, 138–148. URL: https://doi.org/10.1016/j.ijid.2020.09.1464, doi:10.1016/j.ijid.2020.09.1464
Mosley, T. J., Zajdel, R. A., Alderete, E., Clayton, J. A., Heidari, S., Pérez-Stable, E. J., … Bernard, M. A. (2025). Intersectionality and diversity, equity, and inclusion in the healthcare and scientific workforces. Lancet Regional Health — Americas, 41, 100973. URL: https://doi.org/10.1016/j.lana.2024.100973, doi:10.1016/j.lana.2024.100973
Stutt, R. O. J. H., Retkute, R., Bradley, M., Gilligan, C. A., & Colvin, J. (2020). A modelling framework to assess the likely effectiveness of facemasks in combination with `lock-down' in managing the COVID-19 pandemic. Proceedings of the Royal Society A, 476(2238), 20200376. URL: https://doi.org/10.1098/rspa.2020.0376, doi:10.1098/rspa.2020.0376
Talic, S., Shah, S., Wild, H., Gasevic, D., Maharaj, A., Ademi, Z., … Ilic, D. (2021). Effectiveness of public health measures in reducing the incidence of COVID-19, SARS-CoV-2 transmission, and COVID-19 mortality: systematic review and meta-analysis. BMJ, 375, e068302. URL: https://doi.org/10.1136/bmj-2021-068302, doi:10.1136/bmj-2021-068302
Wasserman, D., van der Gaag, R., & Wise, J. (2020). The term “physical distancing” is recommended rather than “social distancing” during the COVID-19 pandemic for reducing feelings of rejection among people with mental health problems. European Psychiatry, 63(1), e52. URL: https://doi.org/10.1192/j.eurpsy.2020.60, doi:10.1192/j.eurpsy.2020.60
Wilde, R. (2018). Joseph Stalin's Death—He Did Not Escape the Consequences of His Actions.
Wintour, P. (2020). Covid-19 Will Devastate Poorest Nations if West Does Not Act, Warns UN: G20 Told to “Step Up Now or Pay Price Later”.
Wurth, R. C., Braxton, M. L., & Cohen, C. L. (2020). Racism and Covid-19 Threaten Our Health—We Can't Fight Them as Separate Battles.
John of Ephesus, & Pearse, R. (543CE, 2017). John of Ephesus Describes the Justinianic Plague.
National Center for Health Workforce Analysis, & Health Resources and Services Administration (2014). Sex, Race, and Ethnic Diversity of U.S. Health Occupations (2010–2012). U.S. Department of Health and Human Services.