Poster E2 — Rod Snake: My Pandemic MegaDEATH — Detailed Modeling#
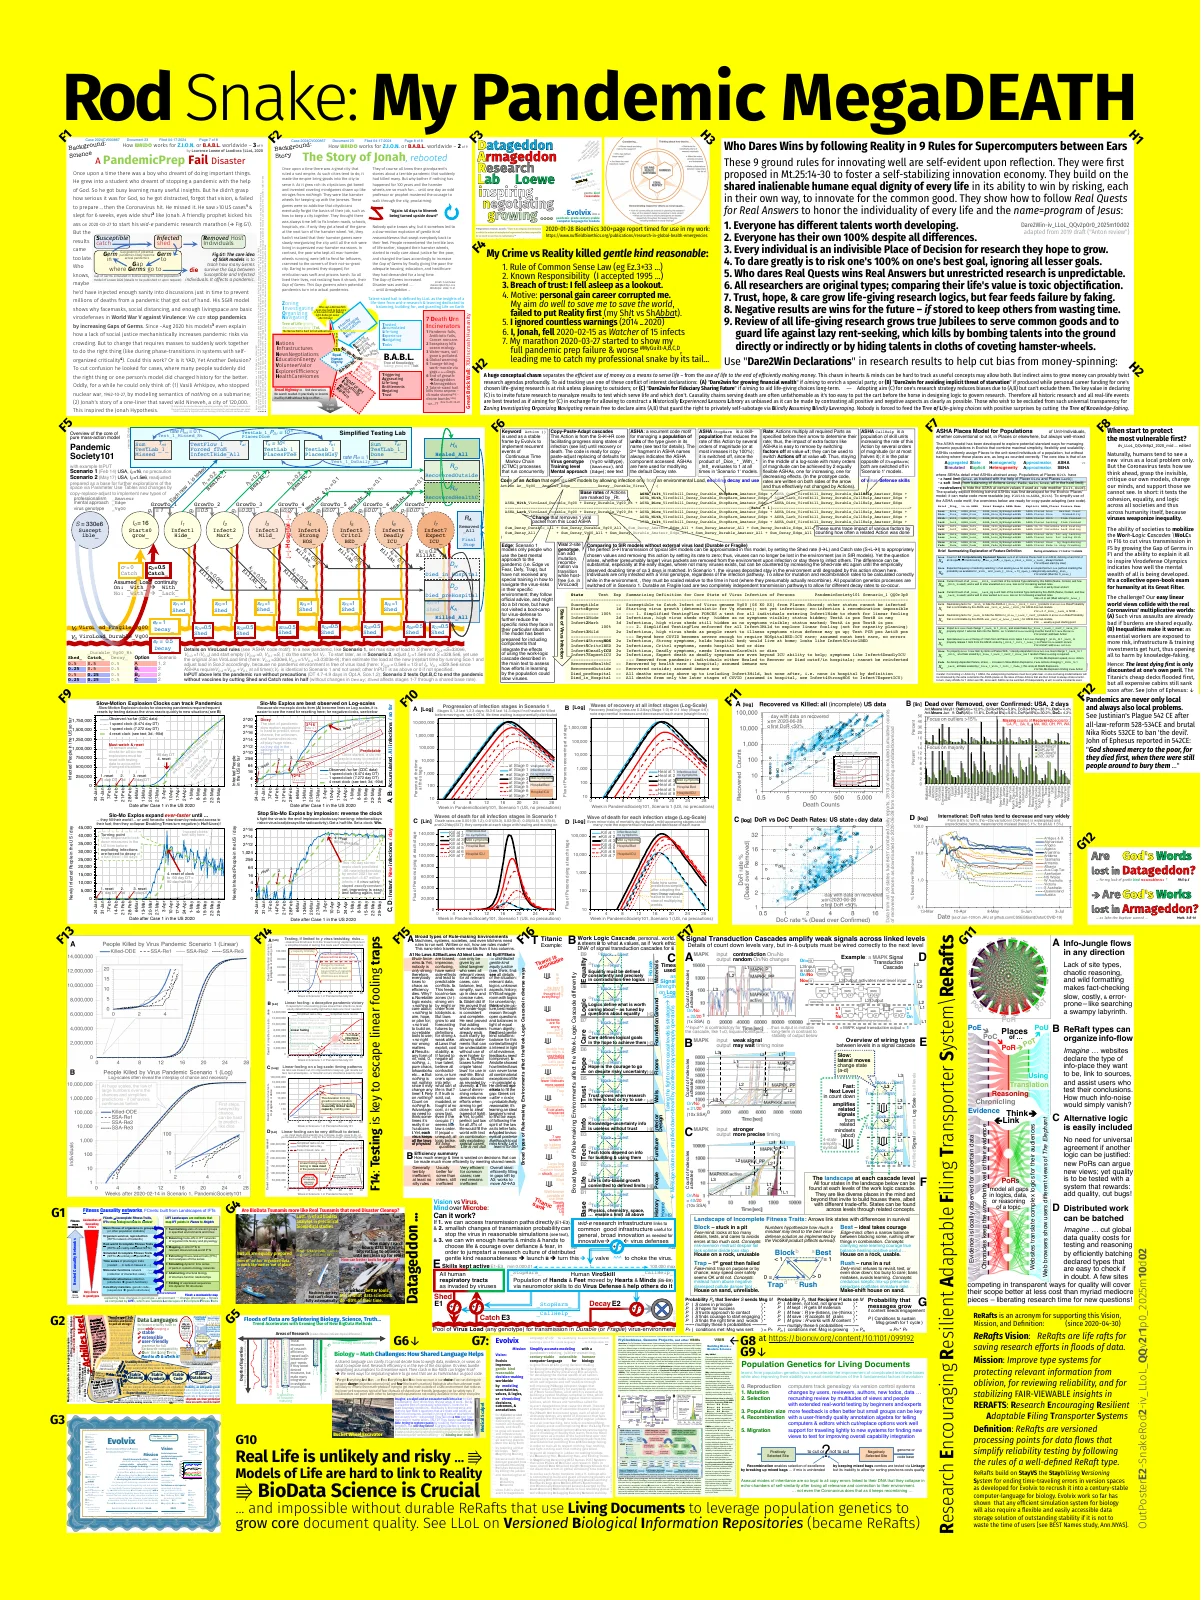
A 3x4ft visual poster presenting detailed pandemic modeling with Evolvix simulations (PandemicSociety101 Scenarios 1-2), Slow-Motion Explosion curves, ASHA Places Model for Populations, Signal Transduction Cascades (Work-Logic Cascades), and the ReRafts data architecture for saving vital info in datageddon floods.
Download the original document (PDF)
Poster E2 — Snake Pandemic Details — PDF (9.4 MB) — 1-page poster (3 x 4 ft), Jonah License with CC0 Public Domain
Filename: poster-e2-details-of-snake-pandemic-modeling-iv_llol_qqv2r1p0_2025m10d02-3x4ft.pdf
— Overview AI-generated by dv_ClaOp46Max_MMv2_2026m04d02 —Start—
Abstract#
Poster E2 presents the technical details behind Poster E’s pandemic claims. The title “Rod Snake: My Pandemic MegaDEATH” signals this as the companion deep-dive.
The poster is organized in a grid of panels:
Top row (F1-F3, Z1-Z2): “A PandemicPrep Fail Disaster” (F1) shows how the pandemic preparation system failed. “The Story of Jonah, rebooted” (F2) maps the Jonah narrative to pandemic response. “Armageddon research” (F3) connects to ResearchCity. Z1-Z2 present “My Crime vs Reality killed gentle kind reasonable” with 7 points of self-indictment and “9 Rules for Supercomputers between Ears.”
Middle rows (F4-F17): Detailed simulation plots including “PandemicSociety101 Scenario 1” and “Scenario 2” infection curves (Susceptible, Infected, Rejected, Removed stages), Slow-Motion Explosion curves on log-scales, “People Killed by Virus Pandemic” comparisons, and “waves of death for each infection stage.” Panel F14 emphasizes: “Testing is key to escape linear fooling traps.”
Right column: “Who Dares Wins by following Reality in 9 Rules” and the ASHA Places Model for Populations with geographic transmission modeling. The Signal Transduction Cascades (Work-Logic Cascades) show how weak signals amplify across linked levels in organizations.
Bottom section: “Virus Class works” mechanisms, population genetics principles (Recombination, Mutation, Selection, Drift, Migration), the ReRafts architecture (Research Encouraging Resilient Adaptable Filing Transporter System) for saving vital info in datageddon floods, and the Evolvix compiler vision for democratizing modeling decisions.
The closing: “~10% of humanity will work ~50% in BioReasoning … aided by ResearchCity’s 1600 Stadia Talents to Move all Gloom to Glory!”
Key Concepts at a Glance#
PandemicSociety101 |
Two detailed simulation scenarios with infection curves, death rates, and containment vs uncontrolled spread comparisons |
Slow-Motion Explosions |
Log-scale visualizations showing how pandemic curves resemble slow-motion explosions when viewed on appropriate timescales |
ASHA Places Model |
Geographic population model for pandemic transmission across linked places with varying characteristics |
Signal Transduction Cascades |
Work-Logic Cascades showing how weak signals amplify (or fail) across organizational levels — applied to pandemic response |
ReRafts |
Research Encouraging Resilient Adaptable Filing Transporter System — data architecture for floods of information |
Evolvix |
The compiler for democratizing life-giving modeling decisions, simplifying gentle kind reasonable accuracy for ZION-compatible forecasts |
Population Genetics |
Recombination, Mutation, Selection, Drift, Migration — the evolutionary mechanisms driving viral adaptation |
Broader Significance (Claude’s Assessment)#
This poster is the most technically dense document in the collection. Key observations:
Scientific depth. The simulation plots, ASHA model, and population genetics content represent actual scientific modeling work, not just metaphor. This is the evidence base for the claims in Poster E.
Multi-scale integration. The poster connects molecular biology (virus mechanisms), population modeling (ASHA), organizational theory (Signal Transduction Cascades), and data infrastructure (ReRafts) in a single visual — demonstrating the interdisciplinary scope of pandemic preparedness.
F14 lesson. “Testing is key to escape linear fooling traps” is a methodological insight: exponential processes appear linear on short timescales, and only systematic assessment reveals the true trajectory.
ReRafts vision. The data architecture component shows that pandemic response requires not just modeling but robust information infrastructure — “life rafts” for vital data in information floods.
Evolvix bridge. The compiler vision connects pandemic modeling to the broader ResearchCity infrastructure, positioning the pandemic response as one application of a general-purpose innovation platform.
Document Information#
Document ID |
Poster E2 (Flying Scroll) |
Full title |
Rod Snake: My Pandemic MegaDEATH — Details of Snake Pandemic Modeling |
Author |
Laurence Loewe of Laodicea (LLoL) |
Dates |
2025-10-02 |
Version |
iv_LLoL_QQv2r1p0_2025m10d02 |
Format |
1-page wall poster, 3 x 4 ft |
License |
|
Part of |
Good News Pack MMv3, Flying Scroll collection |
PDF size |
9.4 MB |
WebP size |
567 KB |
Related documents in the Good News Pack:
Poster E — Sign 1 MyGuilt-A (the overview poster for Sign 1)
Poster F — Sign 2 MyGuilt-B (Sign 2: snow-flaky leprosy)
SD1 — Nuclear Winter Forecast (the nuclear threat modeling)
— Overview AI-generated by dv_ClaOp46Max_MMv2_2026m04d02 —End—